USDCHF Key Levels
Support: 0.9220, 0.8900
Resistance: 0.9450, 0.9360
USDCHF Price Analysis
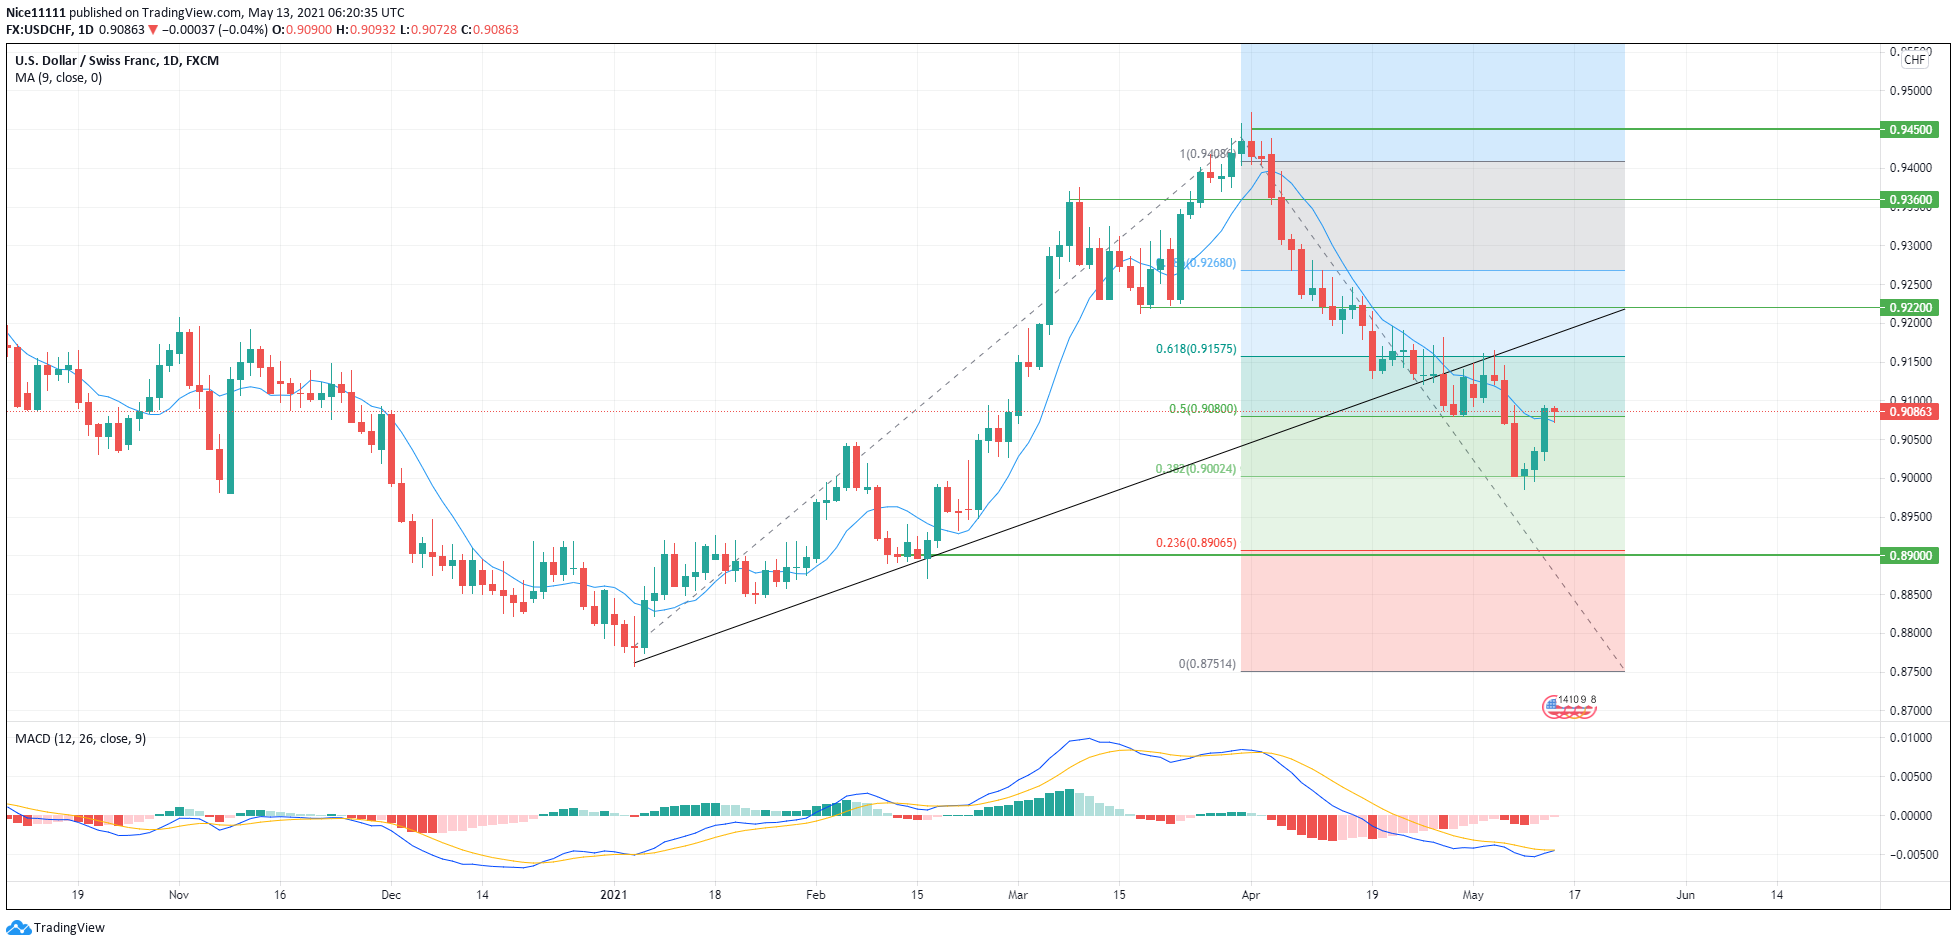
The USD currency has greatly weakened against the CHF. The bullish run of USDCHF was reversed to a bearish run on the 1st of April this year. Price has dipped afterward into discount levels below the equilibrium. The bearish run broke through the support zone at 0.9220 and also the resistance zone at 0.9220. The price plunged aggressively below the bullish trend line and dipped further after retesting it. The bearish run has seemed to pause at 0.90000.

Throughout the bearish run, the MACD (Moving Average Convergence Divergence) lines also dropped below the zero level.
The moving average has also rested above most of the candles’ bodies showing a bearish run.
USDCHF Price Prospects
USDCHF rested on the Fibonacci support level at 0.90000. It has since then moved higher. The price might likely seek the next support at 0.9220.
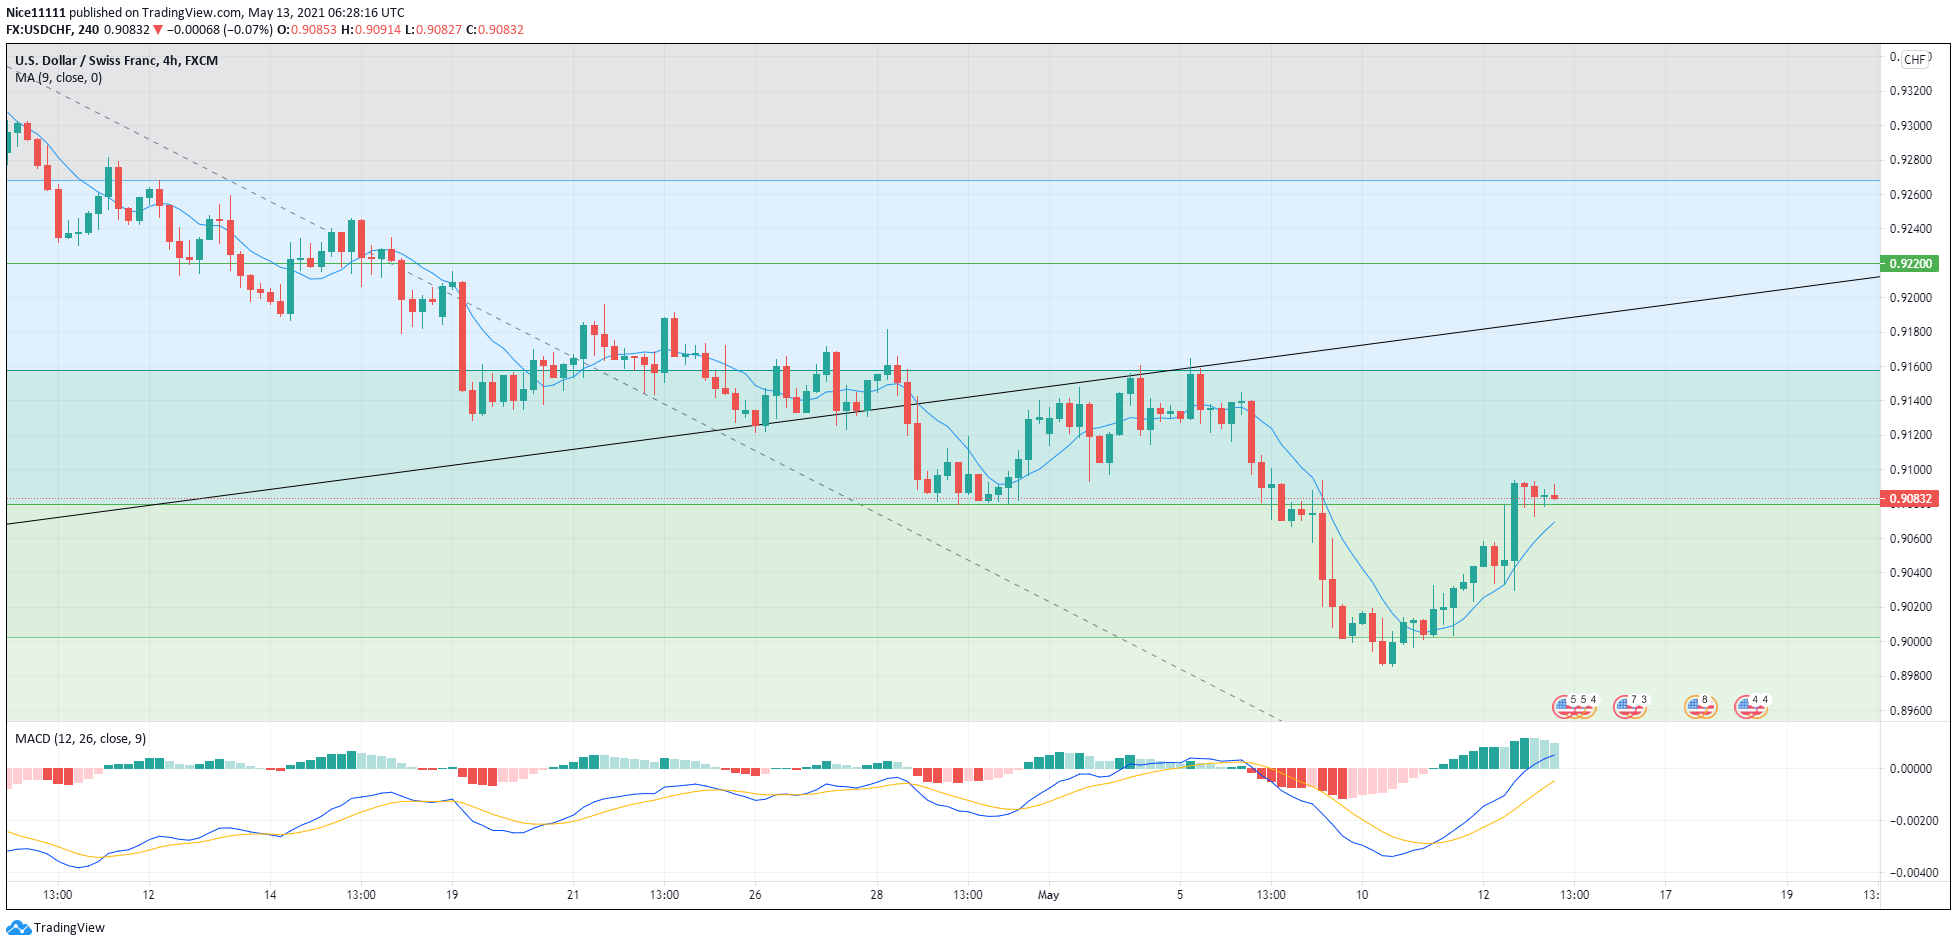
The moving average is beginning to change position. It smashed into the bodies of the candles on the 4th and 6th of May. The Moving average is currently below today’s daily candle which signals that price might go higher.
The MACD also has its lines crossed below the zero level which gives an alert for a change in direction. The histogram bars on the MACD indicator below the zero mark are seen to fade gently signaling that the direction of the price is likely to change upwards. On the four-hour chart, the Moving Average has shown due support as it lies have the candles pushing the price upwards.
The MACD has also shown the recent bullishness since the price hit the 0.382 support level. The MACD lines crossed and have gone higher just as the price of USDCHF has been bullish over the past few days.
The U.S. Dollar is likely to keep on strengthening against the Swiss Franc.
Note: Forexschoolonline.com is not a financial advisor. Do your research before investing your funds in any financial asset or presented product or event. We are not responsible for your investing results.


Leave a Reply