USDCHF Analysis – the Price Established a New Higher Low to Signal the Likely End of the Bearish Run
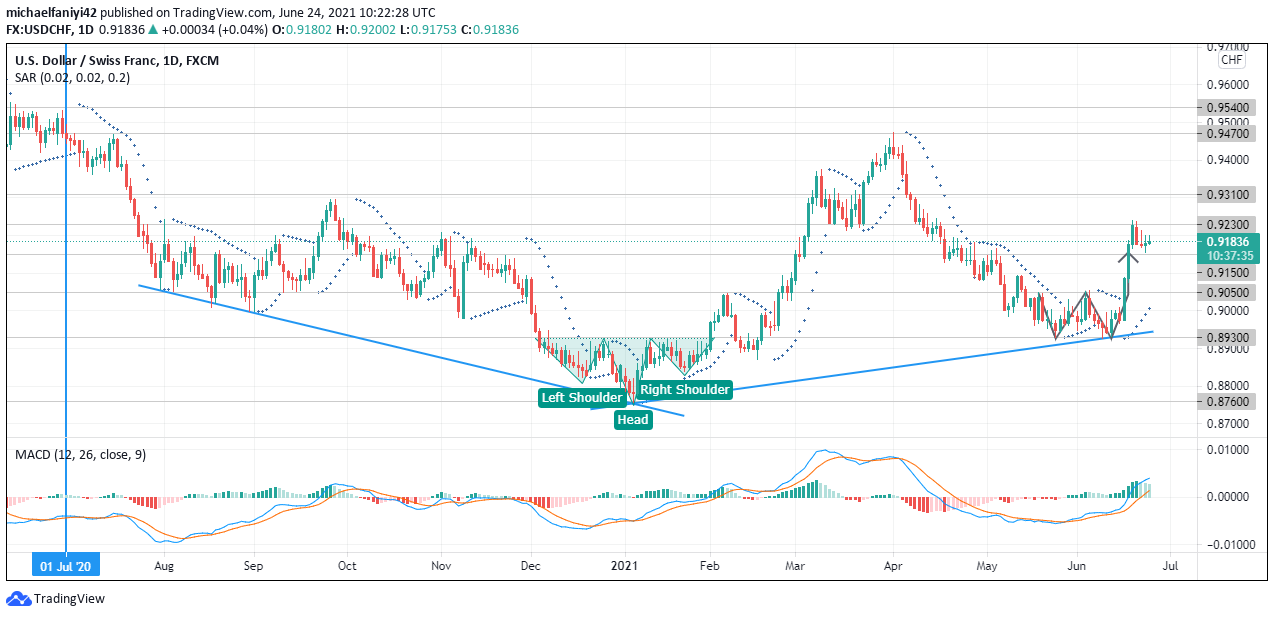
USDCHF has established a higher high and a lower low, and it is likely at the end of its bearish run. The market began a bearish run in the middle of last year when the price failed to surmount the 0.95400 barrier. The bears took control of the market, driving it below 0.94700 before plummeting to the 0.90500 key level.
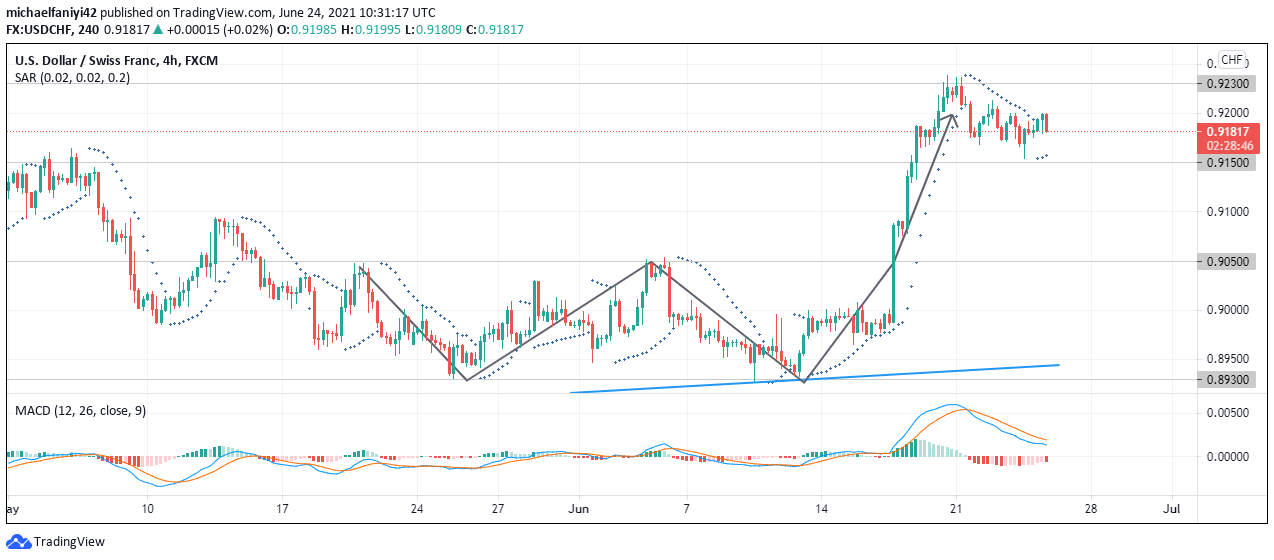
USDCHF regained some stability but was still overall under bearish pressure. The buyers attempted to lift the market and drove the price up to 0.93100, only to be met with immediate rejection. By the start of the year 2021, the price had fallen to a new low at the 0.87600 key level. At this point, USDCHF bulls forged the market into an inverted head-and-shoulder reversal formation to shoot the price up. The price settled below 0.94700, a higher-priced level and the new year’s high. The buyers got exhausted and the market began another swift descent under bearish pressure. The fall in the market was halted by the 0.89300 support for a higher low. The bulls again launched another reversal pattern (double bottom reversal pattern) which has now propelled the price up to the 0.92300 key level.
Currently, the market has pulled back a little to gain support at 0.91500. The current pullback in the daily chart is indicated by the dwindling histogram bars of the MACD (Moving Average Convergence Divergence). However, its signal lines have crossed the zero mark upwards to show a change in direction. This is the same with the Parabolic SAR (Stop and Reverse), which already displays 7 dots below the candles.
USDCHF Key Levels
Resistance Zones: 0.95400, 0.94700, 0.93100, 0.92300
Support Zones: 0.91500, 0.90500, 0.89300, 0.87600
USDCHF Market Anticipation
To continue its ascent, the market has retreated to 0.91500 as a support level. The buyer’s goal will be to push the market past the year’s high to a 0.95400 higher high. After the pullback, the Parabolic SAR now has three dots under the 4-hour chart to show a resumption of the upward trend. The MACD’s falling lines indicate the current market retracement, but its dwindling bars indicate that there is now an upward movement.
Note: Forexschoolonline.com is not a financial advisor. Do your research before investing your funds in any financial asset or presented product or event. We are not responsible for your investing results.


Leave a Reply