USDCHF Analysis – The Market’s Double Bottom Formation Breaks Down
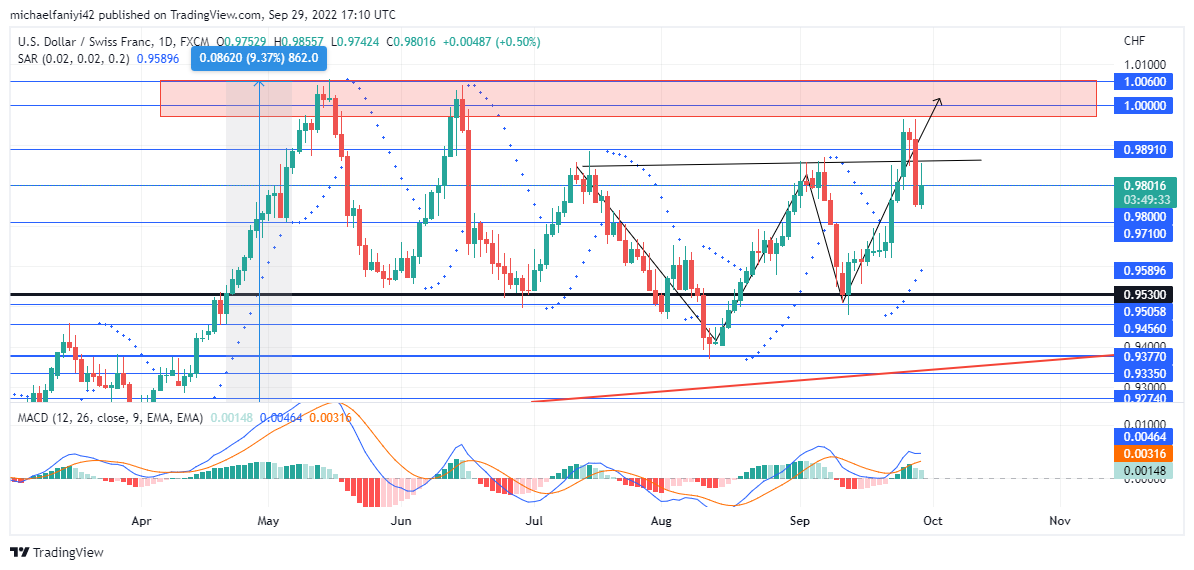
USDCHF’s double bottom bullish reversal formation has not been fully utilized by the market and as such, it has broken down. There is an ongoing tussle between the buyers and the sellers to retain the price above the 0.95300 critical level or not. The buyers have strongly held above the level so far, but their inability to rise higher than 1.00000 often weakens their resolve.
USDCHF Key Zones
Resistance Levels: 1.00000, 0.98910
Support Levels: 0.95300, 0.98000

Repeated failure at the 1.00000 demand level on the 15th of June caused the price to weaken till it drops below the 0.95300 critical level. The dip was not to last long as the buyers instantly recovered off the 0.93770 demand level. The market was pushed strongly upward to form a neckline with the immediate crest. The price then falls back to bounce off the 0.95300 level to complete a double-bottom bullish formation with the potential to break the 1.00000.
However, USDCHF fails to take full advantage of the double-bottom bullish structure. It stops short of breaking the 1.00000 key level and the price has now dropped below the formation neckline. There is still a chance though that the price will re-ignite and rise to break the resistance. The MACD (Moving Average Convergence Divergence) lines remain above the zero level and the histogram bars are evident.

Market Expectation
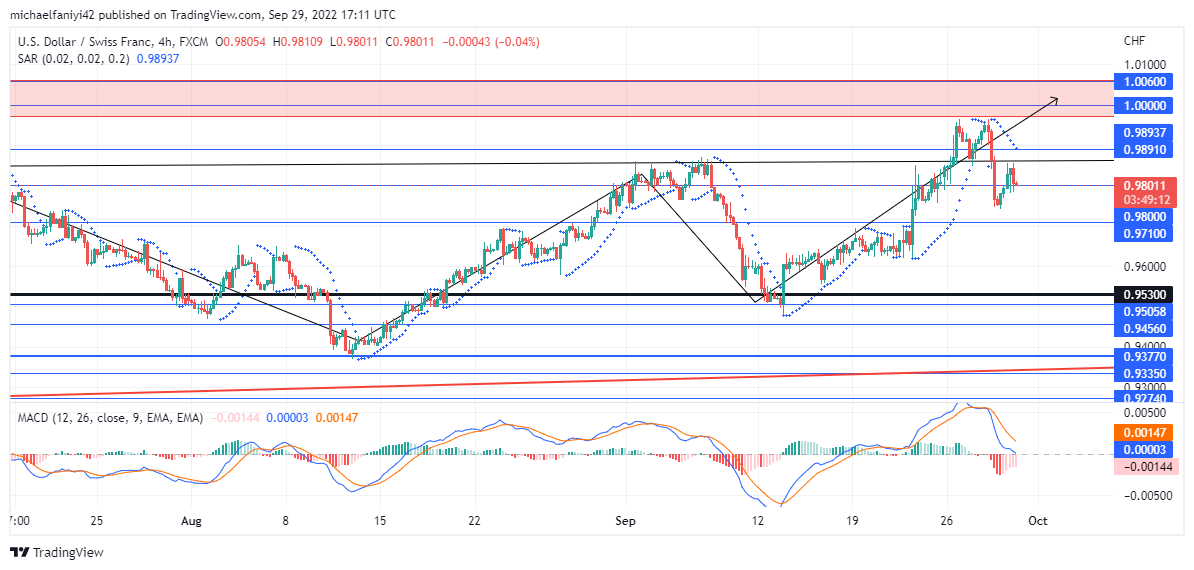
The market is currently trading above the 0.98000 price level, but it has a big task of bypassing the neckline before it pushes towards 1.00000. The short time frame speaks more of a dip with the Parabolic SAR (Stop and Reverse) dots hanging over the candlesticks and the lines of the MACD dropping towards the zero level. If the price fails to break the neckline, it will likely drop back to 0.95300.
Note: Forexschoolonline.com is not a financial advisor. Do your research before investing your funds in any financial asset or presented product or event. We are not responsible for your investing results.


Leave a Reply