USDCHF Analysis – Price Tapers Down in a Triangle Formation and Breaks to the Upside
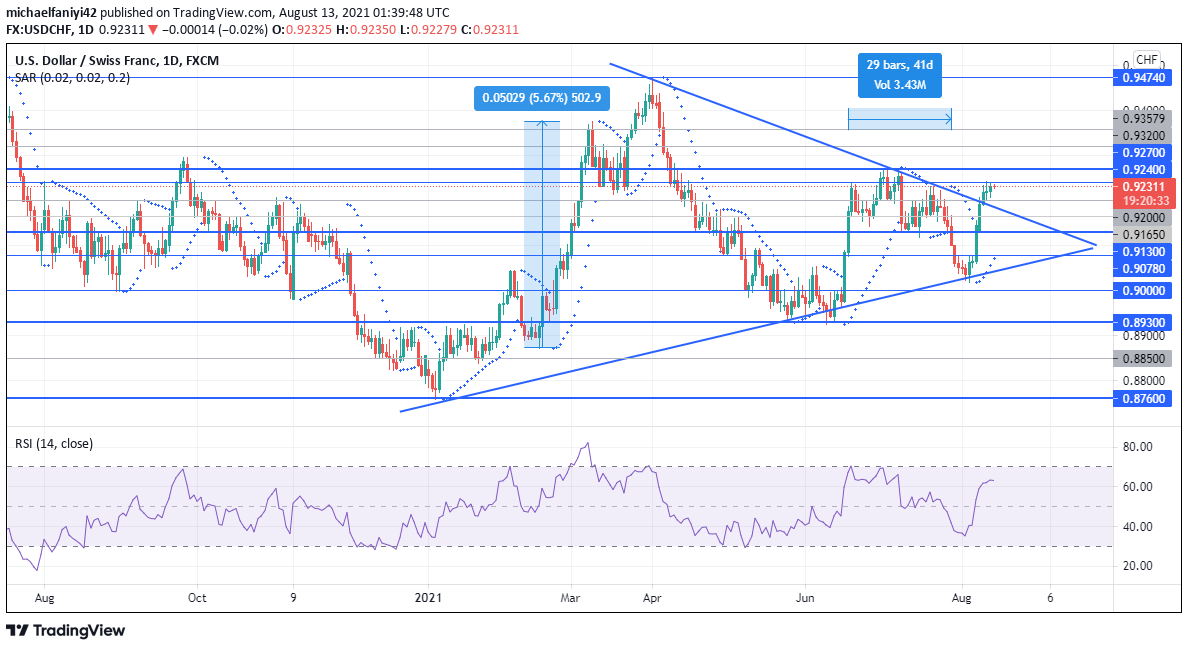
USDCHF breaks to the upside successfully after tapering down in a triangle formation for several months since the beginning of the year. The pattern started when price fell to 0.87600 on the 6th of January 2021. The market took till the end of January before it broke upward of the 0.89300 resistance. A retracement brought USDCHF back below the resistance level before it surged 5% upward. Price will pull back again to 0.92400 before finally attaining 0.94740, the highest key level of the year.
USDCHF Key Levels
Resistance Levels: 0.92400, 0.92700, 0.94740
Support Levels: 0.87600, 0.89300, 0.91300 Bears stepped in to plummet the market and USDCHF immediately began a decline from 0.94740 on the 1st of April 2021. It was something of a free fall and even 0.91300 couldn’t prevent the fall in price. By the 31st of May 2021, USDCHF had fallen to the 0.89300 support zone, which is a higher low to the last plunge in price on the 6th of January. This now forms the lower border of a potential symmetrical triangle. After a little agitation at this level, on the 16th of June, the market surged up in two days to the 0.92400 key level.
There was a major consolidation at this point, in which USDCHF was confined between 0.92700 and 0.91300 for 29 trading days before price breaks downward. The market would only fall below 0.90780 before it surged back up to the 0.92400 resistance level. And by this, it has broken to the upside of a now formed symmetrical triangle. The market is currently trying to break to the upside of 0.92400, and we could see a retracement to the upper border of the triangle before further upward movement.
 Market Anticipation
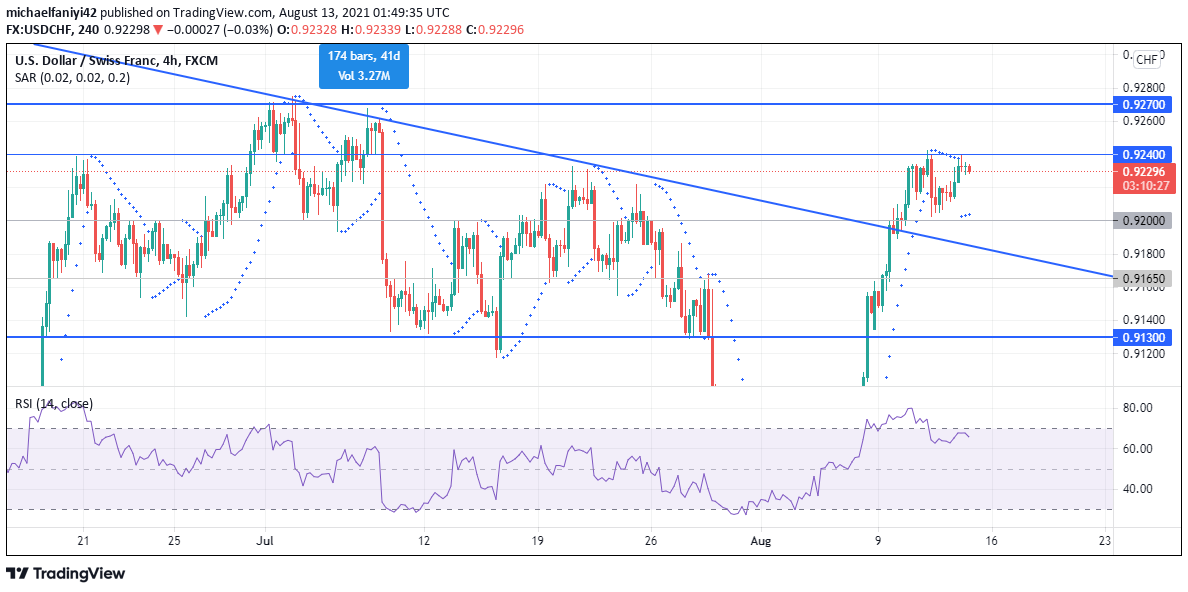
On the 4-hour chart, the market is currently trading around 0.92295. It has thus far failed to get the best of the 0.92400 key level. The Parabolic SAR (Stop and Reverse) still judges the market as bullish with 3 dots under the 4-hour chart. However, the RSI (Relative Strength Index) helps us see that USDCHF is high up in the buying level of the chart at the 65 mark, having just dropped down from the overbought region.
A retracement is on the cards to around the 0.92000 level, after which we can expect the price to break past the 0.92700 major resistance.
Note: Forexschoolonline.com is not a financial advisor. Do your research before investing your funds in any financial asset or presented product or event. We are not responsible for your investing results.


Leave a Reply