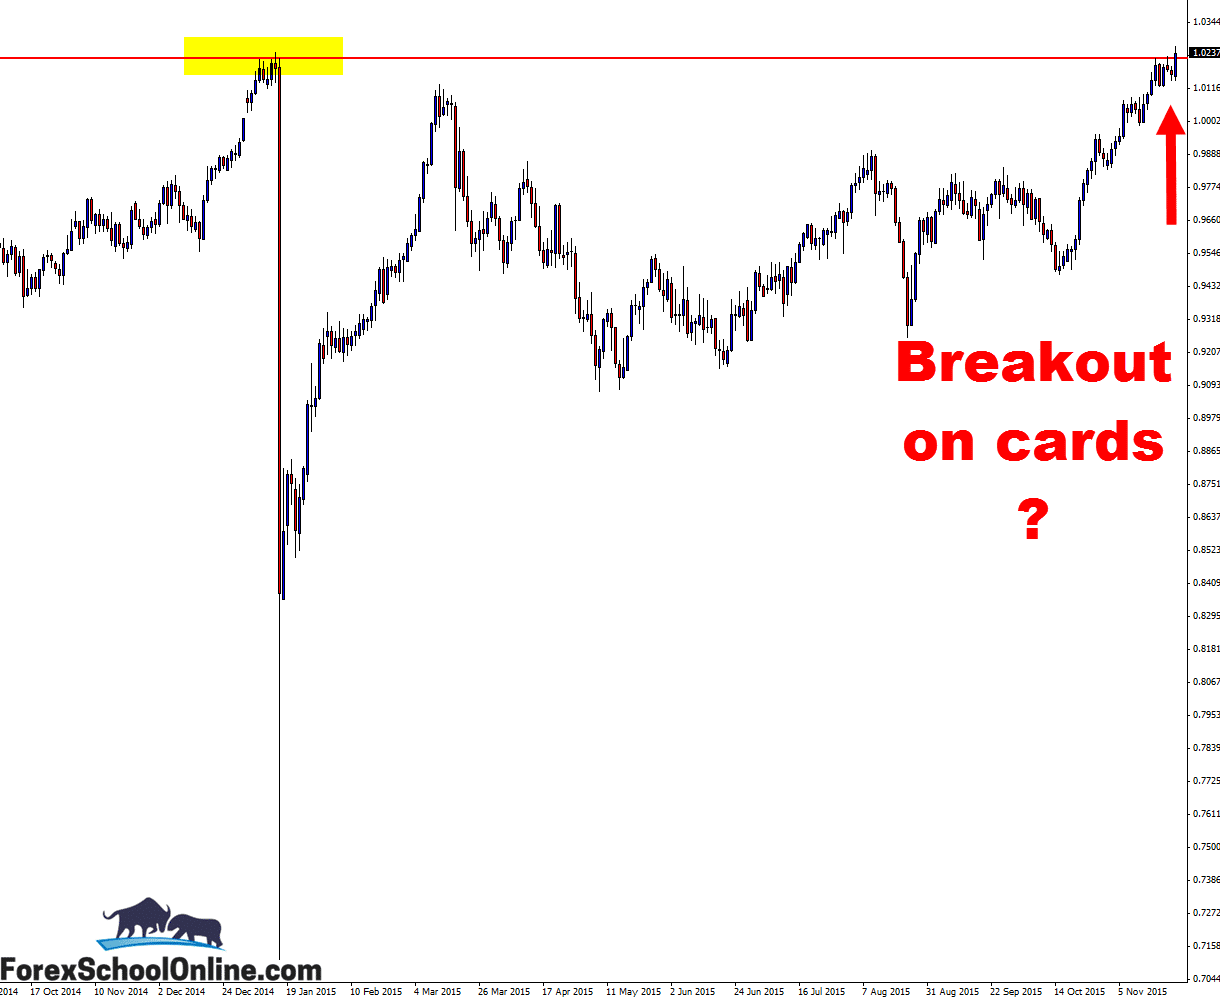
The USDCHF is as I am writing this making an attempt to try and breakout higher through a major daily resistance level. As you can see from the zoomed out chart below; this level is a major daily resistance level that price has respected in the past.
Price over the last week has made two attempts at breaking higher and through this level on the daily chart. The best way to see this in the price action is to look at the candle wicks, to see where price can and more importantly price cannot close.
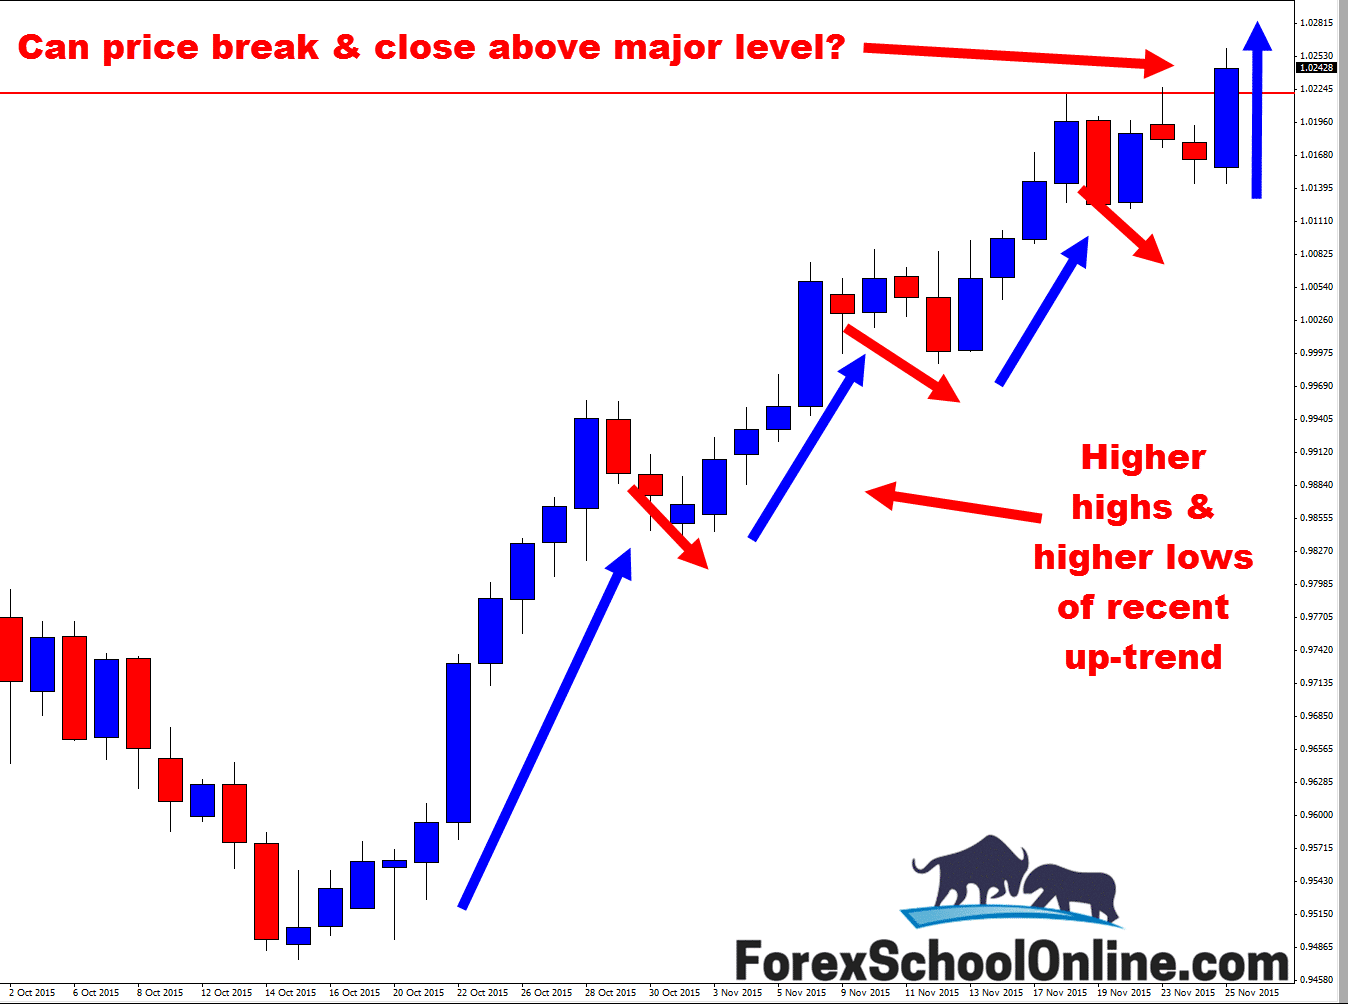
If you look at the first chart below (the zoomed in chart) you will see that price has made two attempts and two candle wicks have tried to push higher and through the resistance, but price has NOT been able to CLOSE up higher and through the resistance level.
In the price action trading lesson and video The Secrets Traders Can Learn From Candlesticks and Price Action I teach you where the most important areas are that you should be watching for these potential breaks of key levels.
The really important factor with this potential breakout is that price is in a strong trend higher. Just as noted on the chart, price has been making really obvious higher highs and higher lows and so if price can breakout and close above, trading higher would be trading with the price action trend which is obviously the best play.
If price can breakout and close above the major level it could open the door for potential breakout trades or even breakout and re-test trades. If you notice price breaking out, you could look for price to make a quick pullback into the old resistance and potential new support area.
If you want to learn more about this and how to make high probability trades using this method, then check out this lesson Using the First Test of Support or Resistance Trade Strategy or if you want to learn how to make advanced trade setups such as breakout and continuations using advanced money management techniques with better stops, then become a Lifetime Forex School Online Price Action Course Member.
Daily Chart – Can Price Breakout With Trend?

Daily Chart – Breakout & Close Above?


Leave a Reply