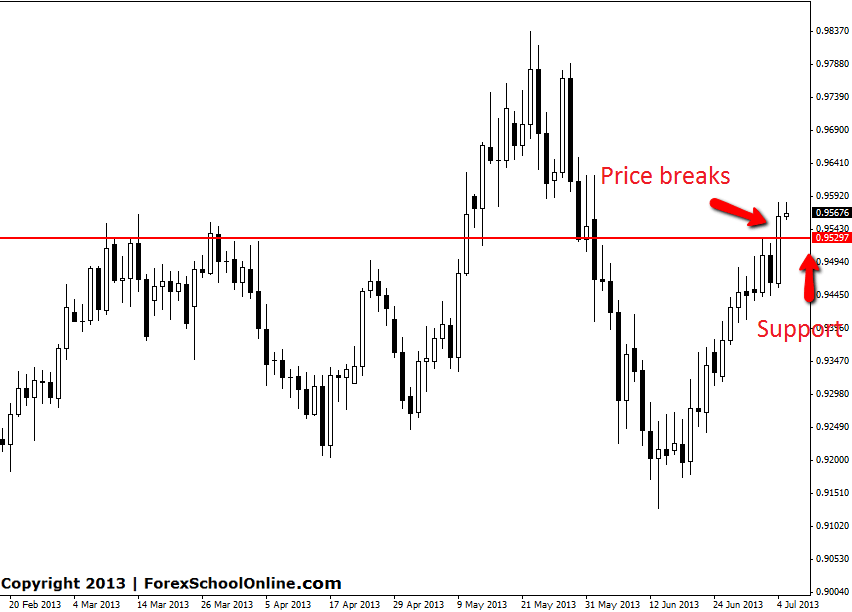
USDCHF Daily Chart
The USDCHF has boomed higher and smashed through resistance in the previous daily session closing well higher. Price has been ranging on the daily chart for the last few months with no clearly defined trend in either direction. When ranges are in play such as in this market the best play is to stick to trading from key levels and short term momentum.
Now price has broken the resistance level, price action traders can look for this level to act as new support should price move back into it. If price does move back lower traders could look to get long if price action was to present any solid signals. Taking trades at this support level would be trading with the recent trend/momentum and also at a logical support level. Trading signals here could be taken on the intraday charts such as the 4hr or 8hr charts.
USDCHF DAILY CHART | 5 JULY 2013

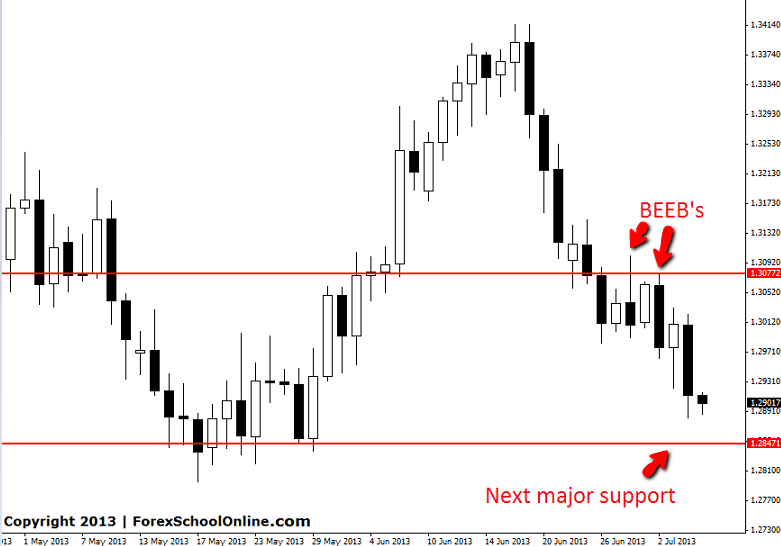
EURUSD Daily Chart
Recently we discussed the bearish look of the EURUSD in this blog and the bearish signals that it had been printing on the daily charts, like the large continuation engulfing bar, that could send price lower. To read that first post see: HERE. Since that post price has sold off and moved lower giving the traders who took the bearish engulfing bar trade a chance to take profit or at the minimum a chance to protect their capital by moving to break even.
EURUSD DAILY CHART | 5 JULY 2013


Leave a Reply