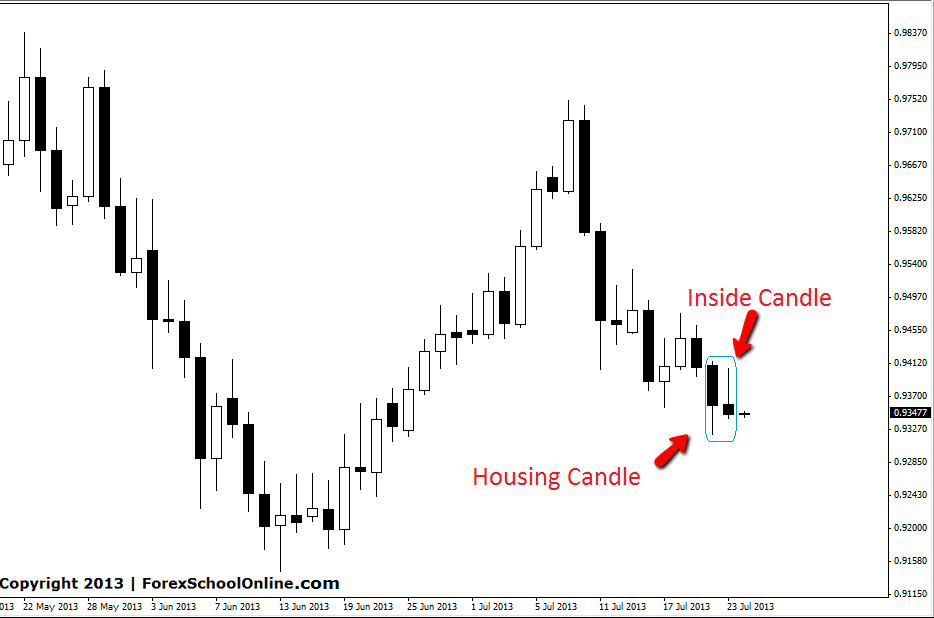
The USDCHF has formed an inside bar on the daily chart. This inside bar is rejecting a key daily resistance area and has closed well lower, ending in a bearish rejection candle. An inside bar is a two candle formation. The first candle is the housing candle. The second candle is the inside candle. This second candle must be completely inside the first hosing candle to be a valid inside bar setup. See the chart below.
A lot of the market is very quite with low volatility at the moment. This is creating a lot of sideways trading and ranging markets. We can see on this pair that price has no clear or obvious trend in either direction, rather it is trading in between key levels. This provides great opportunities to make trades for traders who are switched on and are good at marking their supply and demand areas.
If price can break the low of this inside bar it has some minor trouble areas below to move through. Because this inside bar has formed into the middle of this ranging and not at the high or low it is in the middle of some traffic. Traders could keep an eye on the intraday price action foot prints to gauge exactly what this pair is looking to do if it breaks lower and move into support.
USDCHF DAILY CHART | 24TH JULY 2013


Leave a Reply