The USDCAD price action has shown considerable bullish characteristics in the medium term. It has recovered from several setbacks caused by headwinds along the way thus far. Nevertheless, headwinds seem to have launched another assault, and will this pair shake its effect to retrace even higher? Let’s find out in a bit.
Major Price Levels:
Resistance Levels: 1.3650, 1.3685, and 1.3720
Support Levels: 1.3621, 1.3600, and 1.3575

USDCAD Price Gets Pushed Back After Retracing a Medium-Term Resistance Mark
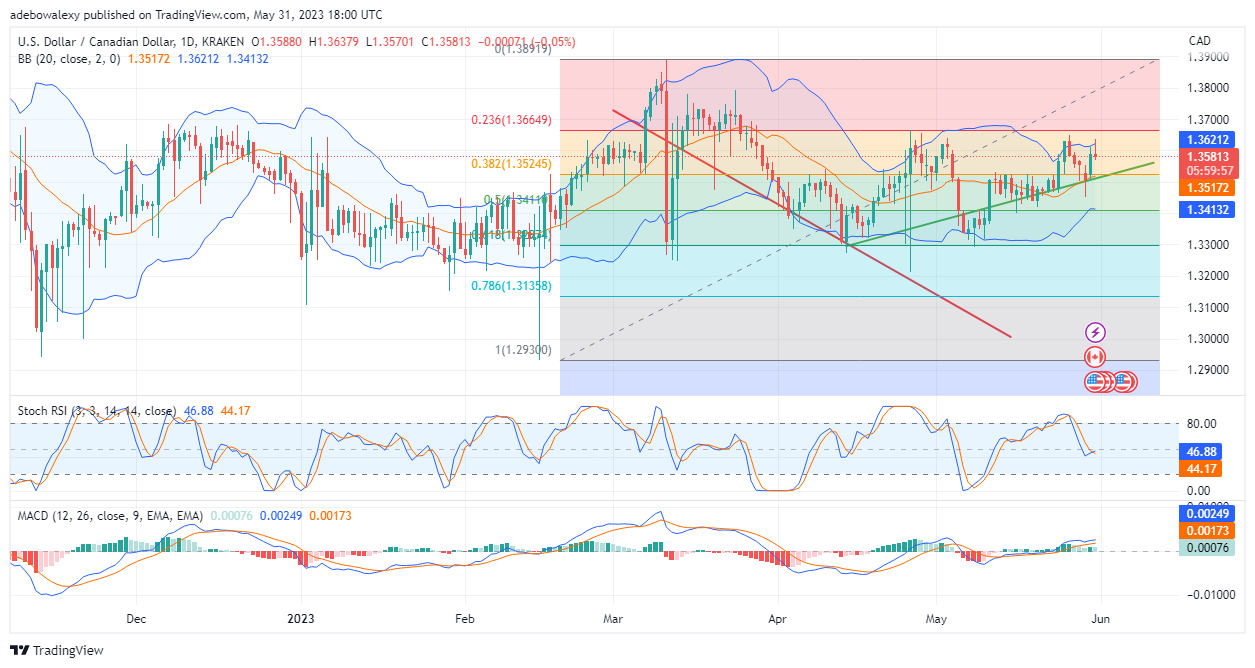
Price activity in the USDCAD daily market has extended its upside retracement into the bear zone on the Fibonacci Retracement tool. However, after price action tested a medium-term resistance around 1.3600, it rebounded off the resistance eastward. Also, signs coming from the Relative Strength Index (RSI) indicator don’t appear that convincing; its bullish crossover seems oriented sideways near level 50. In addition, the last histogram bar of the Moving Average Convergence Divergence (MACD) is now pale green in appearance. Consequently, this signals that upside momentum may be getting weaker, and a further price decline could be witnessed.

USDCAD Appears Ready for More Downward Retracements
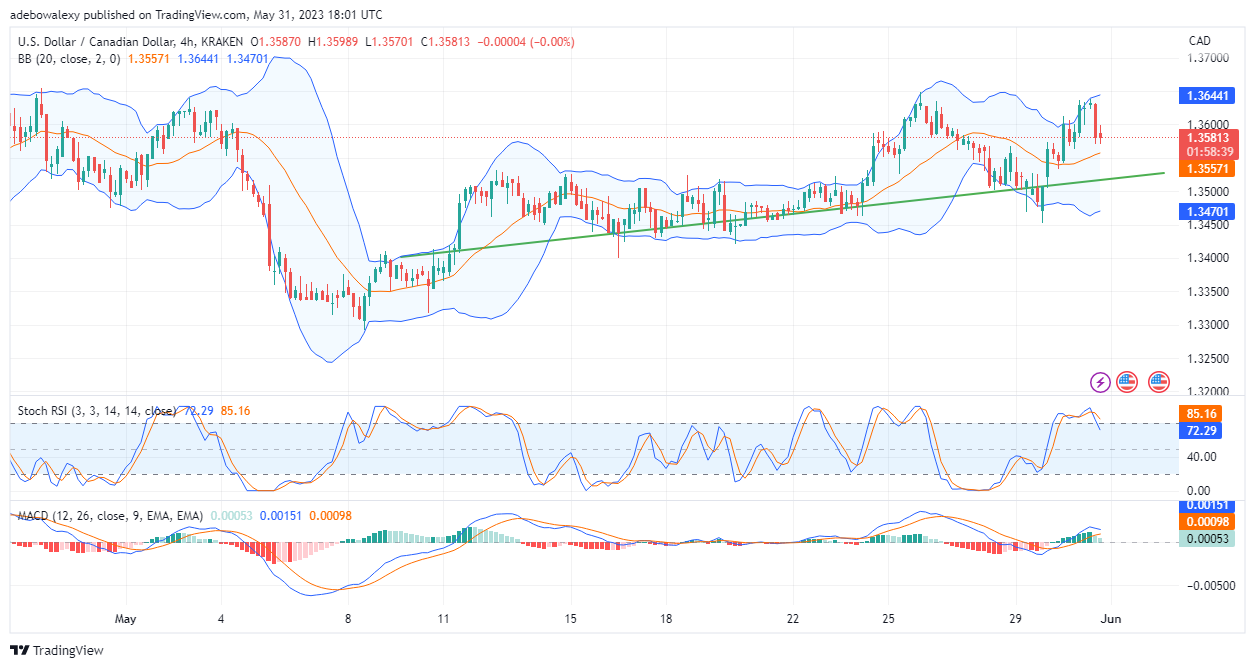
Zooming in on the USDCAD market to a 4-hour market, it is revealed that more downward retracements may be expected in this market. Looking at the recent price candle in the 4-hour market, it could be seen that the price candle before the last one here has seemed to change the tone of technical indicators. Also, the last price candlestick here seems ready to advance the downward retracement. Both the RSI and the MACD indicators are aligned to indicate the same decline in buying momentum. Therefore, traders can anticipate a retracement of the 1.3581 mark shortly, and perhaps lower as trading continues.
Do you want to take your trading to the next level? Join the best platform for that here.


Leave a Reply