The market had looked to the FOMC Minutes for clarity on the US dollar’s trajectory. However, the release provided little support, leaving the greenback struggling. Additionally, the US Dollar Index has fallen to a multi-month low, reaching levels not seen since 2023. This downward momentum has continued to weigh on USDCAD, pushing the pair into a predominantly bearish trend. Let’s delve deeper into the price movements to gain more insight.
Key Price Levels:
Resistance Levels: 1.3600, 1.3700, 1.3800
Support Levels: 1.3500, 1.3400, 1.3000

Bearish Momentum Dominates USDCAD Market
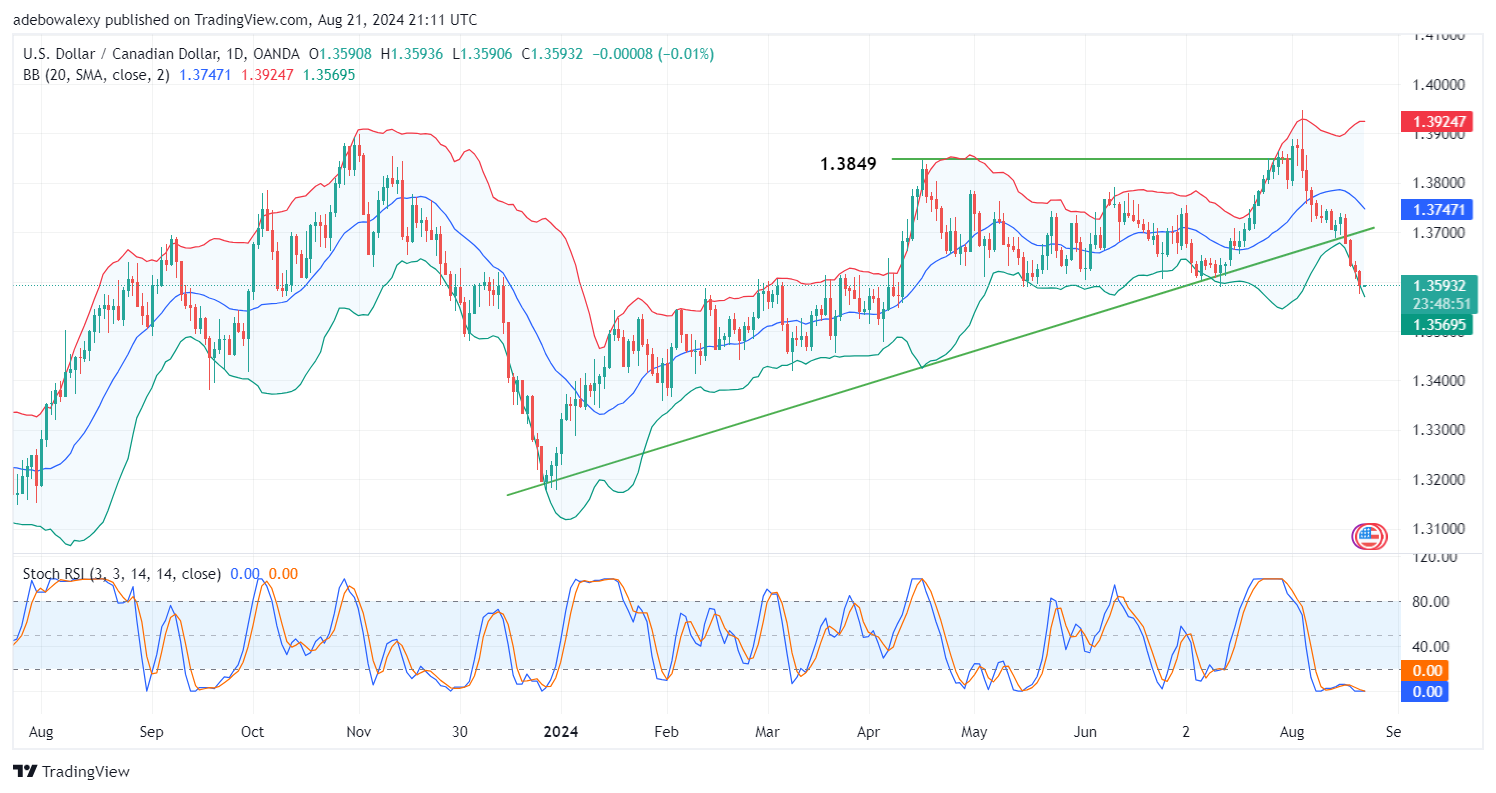
In the daily market, USDCAD has been on a prolonged downward correction. The pair’s price is closely tracking the lower boundary of the Bollinger Bands, where normally a rebound might be expected. However, the strong bearish momentum keeps the price near this lower band.
Current sessions have shown little resistance to the downward trend, with the Stochastic Relative Strength Index (Stochastic RSI) recently attempting a crossover. The trajectory of the Stochastic RSI lines suggests that upward forces are unlikely to drive significant price changes in the near term.

USDCAD Hovers Around the 1.3600 Level
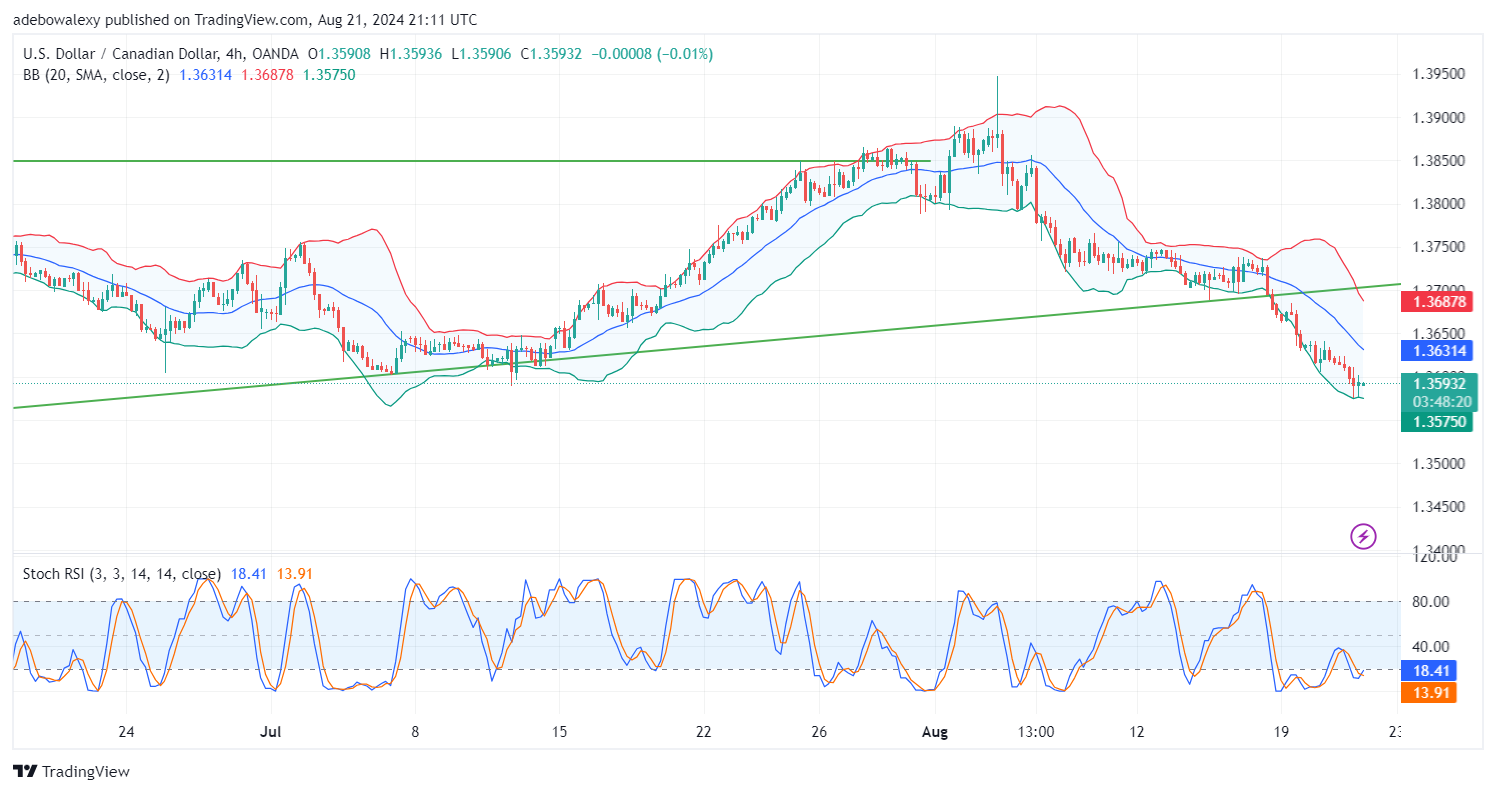
Recent price candles in the USDCAD 4-hour market indicate that the pair is struggling to break through resistance, resulting in stagnant price action for two consecutive sessions. Despite this, the pair remains near the lower limit of the Bollinger Bands.
The Stochastic RSI has produced a bullish crossover below the 20 level, signaling an oversold condition. While this suggests that the 1.3600 level could continue to provide strong resistance, caution is advised. If the price surpasses this level, it may be prudent to wait for further confirmation above the 1.3631 mark before considering more aggressive bullish positions.
Do you want to take your trading to the next level? Join the best platform for that here.


Leave a Reply