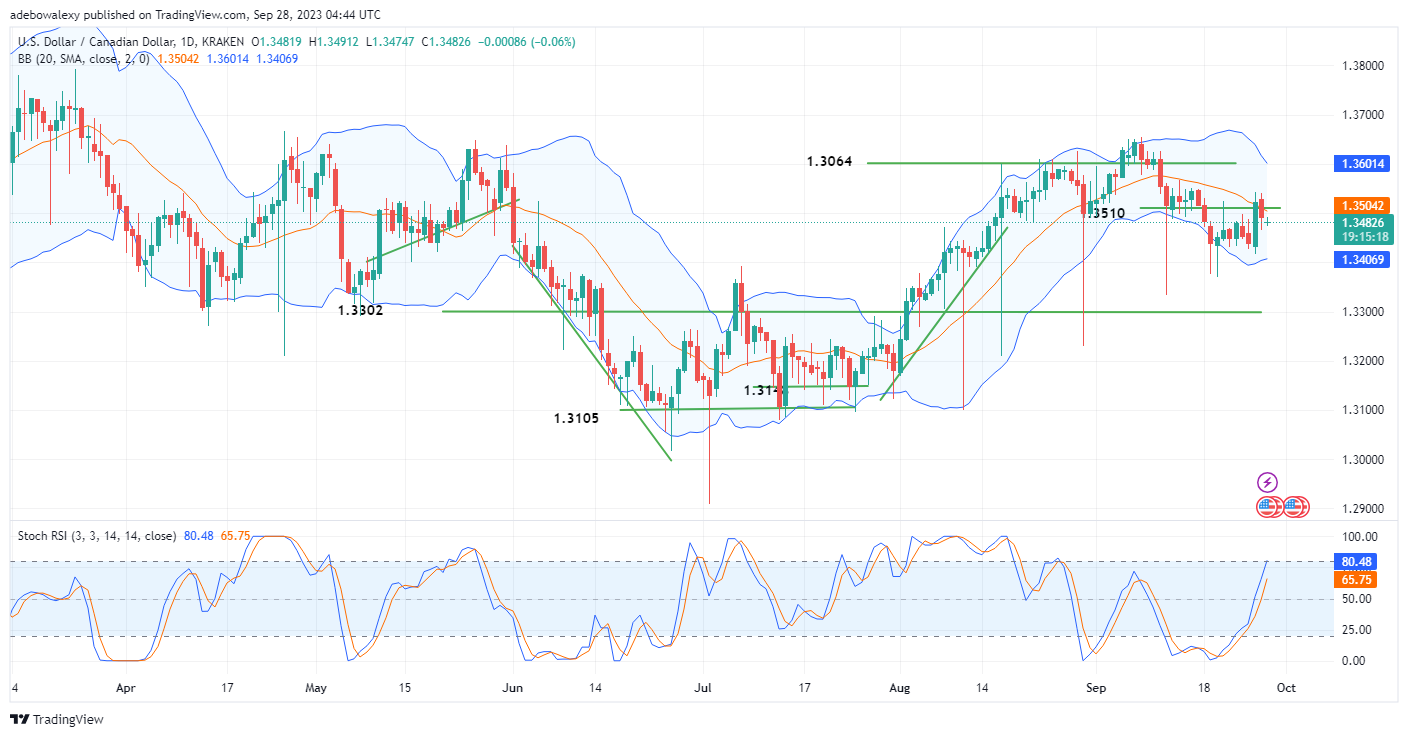
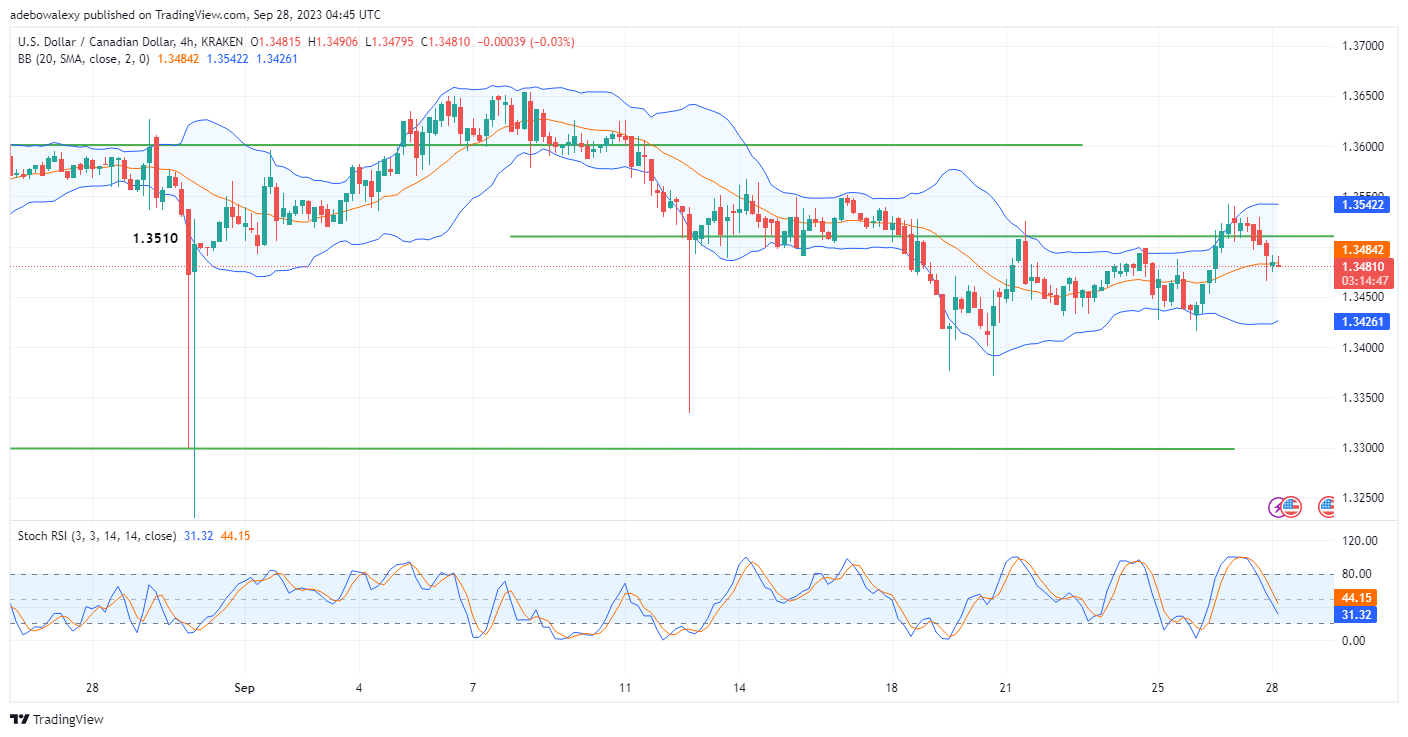
The USDCAD pair had earlier faced support at the 1.3510 mark, but obviously, the support at that price level failed, and the pair now trades below it. Additionally, technical indicators seem divergent on any hopes of price action climbing above 1.3510 as a nearby resistance.
Major Price Levels:
Resistance Levels: 1.3483, 1.3520, and 1.3600
Support Levels: 1.3450, 1.3400, and 1.3350

USDCAD Bulls Look Vulnerable below the 1.3510 Price Level
Following the failure of the support at the 1.3510 price level, USDCAD now trades at 1.3582. However, the daily market shows that upside momentum is still generally on considering the fact that the incurred loss hasn’t exceeded the profit recorded two sessions ago. A tiny-bodied price candle can be seen appearing below the MA line of the Bollinger Bands indicator.
Consequently, this indicates that this market is now trending downward. Although the mentioned price candle appears green, the side of the indicator where it has appeared implies that headwinds are still at an advantage against upside forces.

USDCAD Bear Traders Stand to Record More Gains
The USDCAD 4-hour market has further pointed out that bears have started winning already. It could be seen that the attempts by buyers to abate the downward correction have failed, and a red price candle has appeared for the new session below the MA of the Bollinger Bands indicator.
Additionally, the Relative Strength Index (RSI) indicator curves can now be seen trending downward, confirming the dominance of bears in this market. However, this downward correction on the RSI seems too sensitive, as it may soon be overextended at such a moderate downward correction. Nevertheless, bear traders may still gather some profit towards the 1.3420 mark.
Do you want to take your trading to the next level? Join the best platform for that here.


Leave a Reply