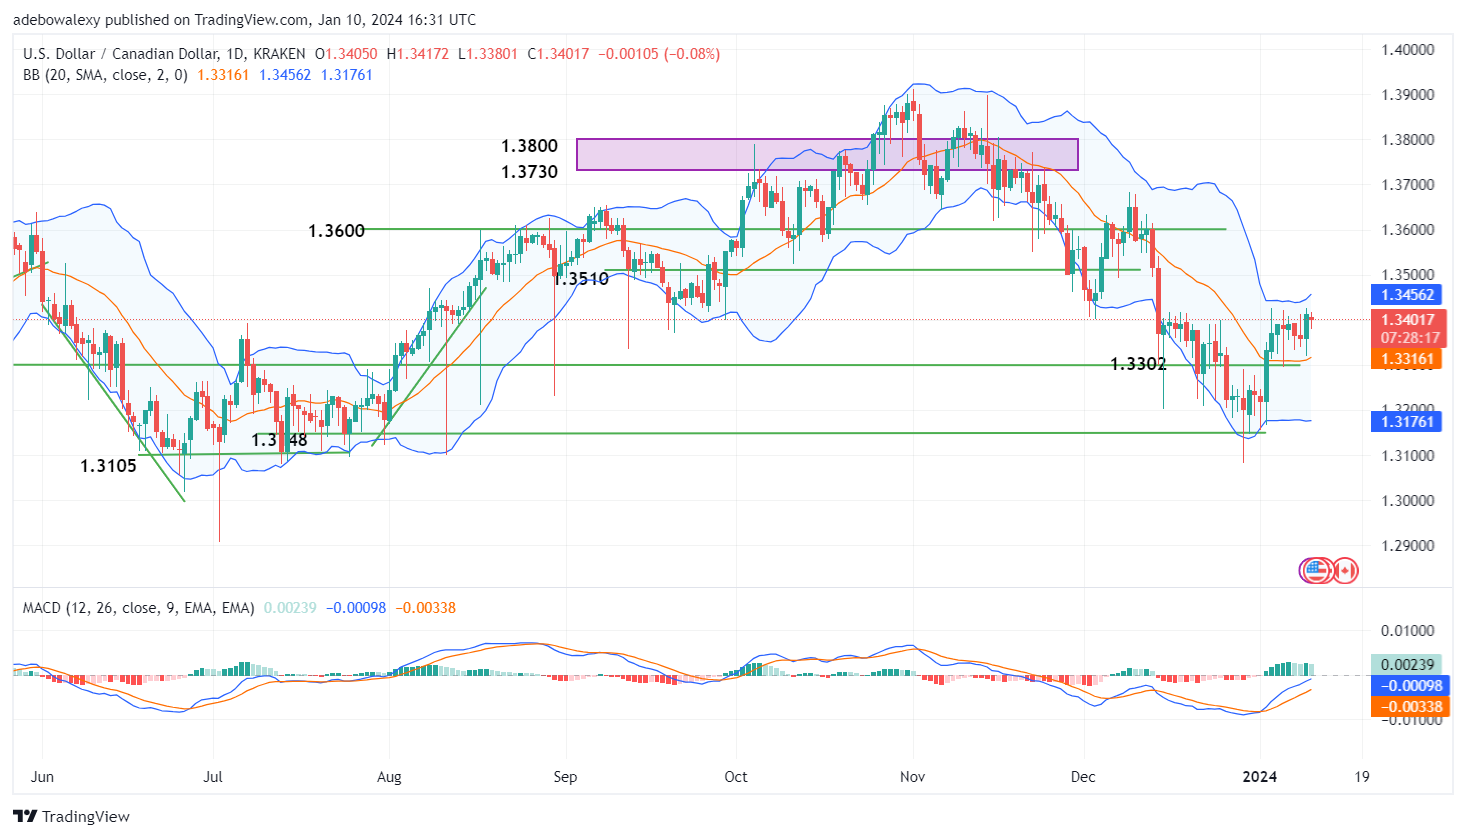
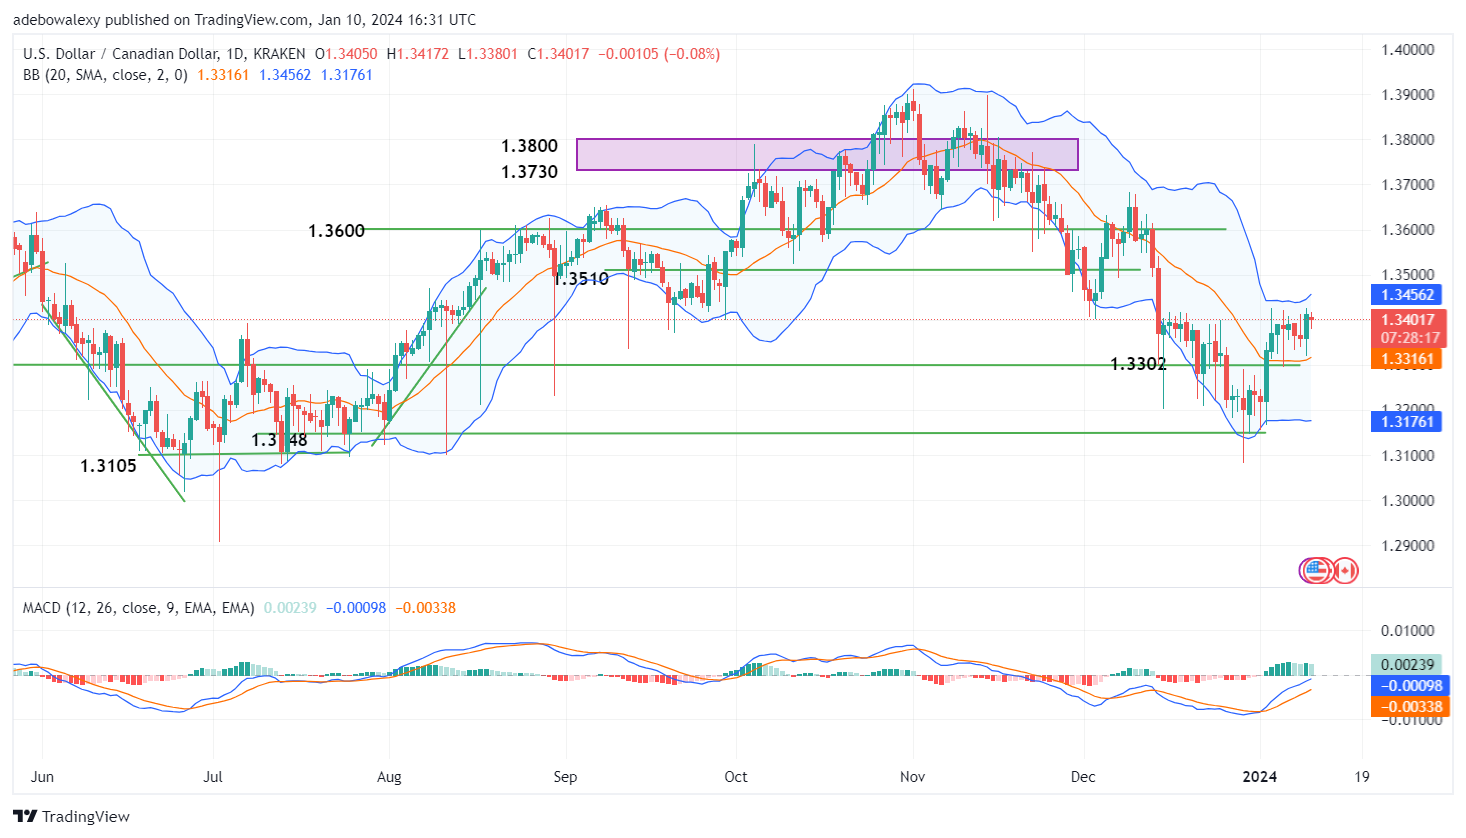
The USDCAD market has retraced to higher levels after price action tested the support at the 1.3100 mark. Since then, it appears that the market has triggered a substantial amount of tailwinds. Although there has been minor impedance along the way, the prevalent trend in the market has been quick to shake off resistance.
Key Price Levels:
Resistance Levels: 1.3500, 1.3600, and 1.3700
Support Levels: 1.3402, 1.3350, and 1.3300

USDCAD Is Facing Rejection
Since the start of today’s trading activities, USDCAD price movement has been impeded around the 1.3400 mark. There have been projections that prices may encroach higher above this threshold. Nevertheless, this hasn’t been realized so far. Yet, trading activities stay above the middle limit of the Bollinger Bands indicator while presenting only minimal downward corrections.
Furthermore, it can also be seen that the Moving Average Convergence Divergence (MACD) indicator lines are still rising towards the equilibrium level. The last bar of this indicator is still pale green in appearance. Consequently, this suggests that there may still be an uptrend continuation in subsequent sessions.

USDCAD May Be Preparing to Takeoff
In the USDCAD 4-hour market, it is revealed that price action is already picking up momentum. It can be seen that the manifesting momentum started in the previous trading session. While it started small, things seem to have grown bigger in the ongoing session. The last price candle on this chart can be seen to have a considerably larger body than that of the previous session.
Meanwhile, all this is happening above the middle band of the Bollinger Bands. Although the Relative Strength Index (RSI) lines still have a general downward trajectory, a careful look at the tails of these lines reveals that they seem to be moving close to each other. By implication, this suggests that this pair may resume the upward correction towards the 1.3500 mark.


Leave a Reply