USDCAD hasn’t benefited from any available fundamentals as its price action continues to hug price baseline levels. This further sets a bearish path for the pair and may initiate more downward corrections. Let’s take a closer look at things in this market.
Key Price Levels:
Resistance Levels: 1.5782, 1.5800, and 1.5900
Support Levels: 1.5700, 1.5600, and 1.5500

USDCAD Bears Eye the 1.3300 Mark
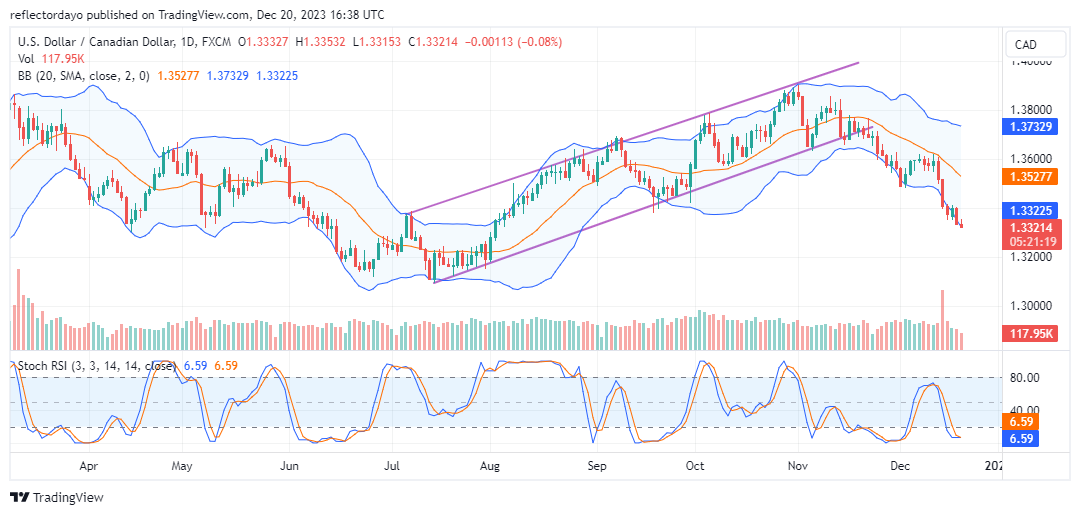
Price action in the USDCAD daily market has continued to trend downward ever since it failed to break through the 1.3600 mark. Although volatility has decreased significantly, it can be observed that short traders are still dominating, even with the thin momentum.
The Relative Strength Index (RSI) indicator lines have reached deep into the oversold level. The indicator lines are now merged but haven’t delivered a bullish crossover. Consequently, this signals that bears are still dominating the market and are ready to keep pursuing lower levels.

USDCAD Bears Are Strongly in Pursuit of More Profits
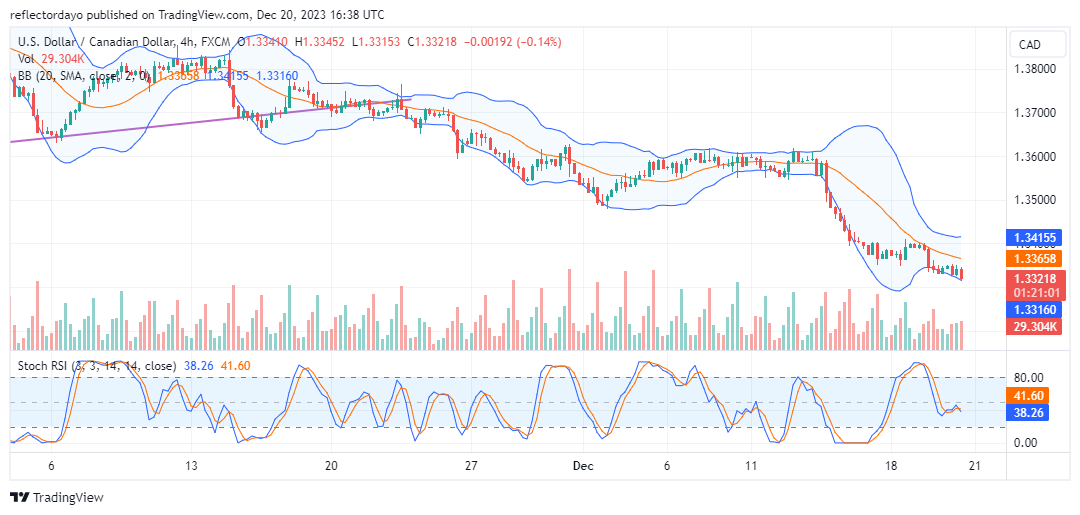
Price action in the USDCAD 4-hour market has demonstrated the will of downward forces in causing prices to fall lower. Here, while price activity has kept on hugging the lowest limit of the Bollinger Bands, it can be seen that the ongoing session has set a strong bearish tone for the pair considering the size of the corresponding price candle.
Even the last Stochastic RSI lines have looked mangled recently. Nevertheless, the latest appearance of the RSI indicator lines has delivered a bearish crossover, signaling the possibility of prices falling toward the 1.3300 support.
Do you want to take your trading to the next level? Join the best platform for that here.


Leave a Reply