The USD has been weak and seems to lack promising fundamentals. This has caused the USDCAD market to lack upside momentum as price action keeps retracing lower levels. Nevertheless, one needs to examine this market to know what it holds for traders in the near term.
Major Price Levels:
Top Levels: 1.3600, 1.3650, and 1.3700
Floor Levels: 1.3550, 1.3500, and 1.3450

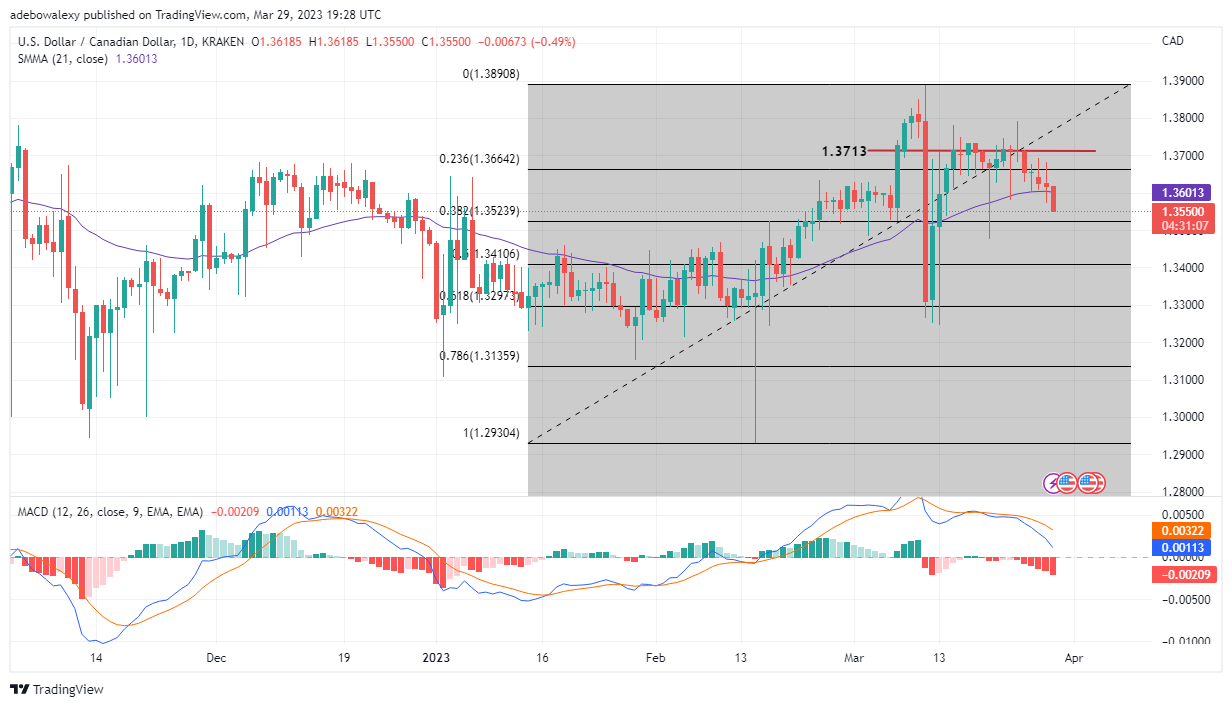
USDCAD Dives Towards the 1.3524 Price Mark
The last price candle on the USDCAD daily market took the pair’s price down by more than 10 points (pips). Also, predominant indications point out that price action in this market may dive lower. Price activity failed to break the resistance at 1.3713. Since then, price action has been downside-bound. In this ongoing session, the price has fallen below the 21-day Smooth Moving Average curve, and this suggests that the market is in a downtrend. Likewise, Moving Average Convergence Divergence (MACD) indicator curves continue to fall toward the equilibrium level. Also, the bars of this indicator can be seen growing taller in the negative direction, and they are red. Consequently, this suggests that prices may fall lower.

USDCAD Bulls Look Helpless as Bear Seeks to Extend the Downtrend
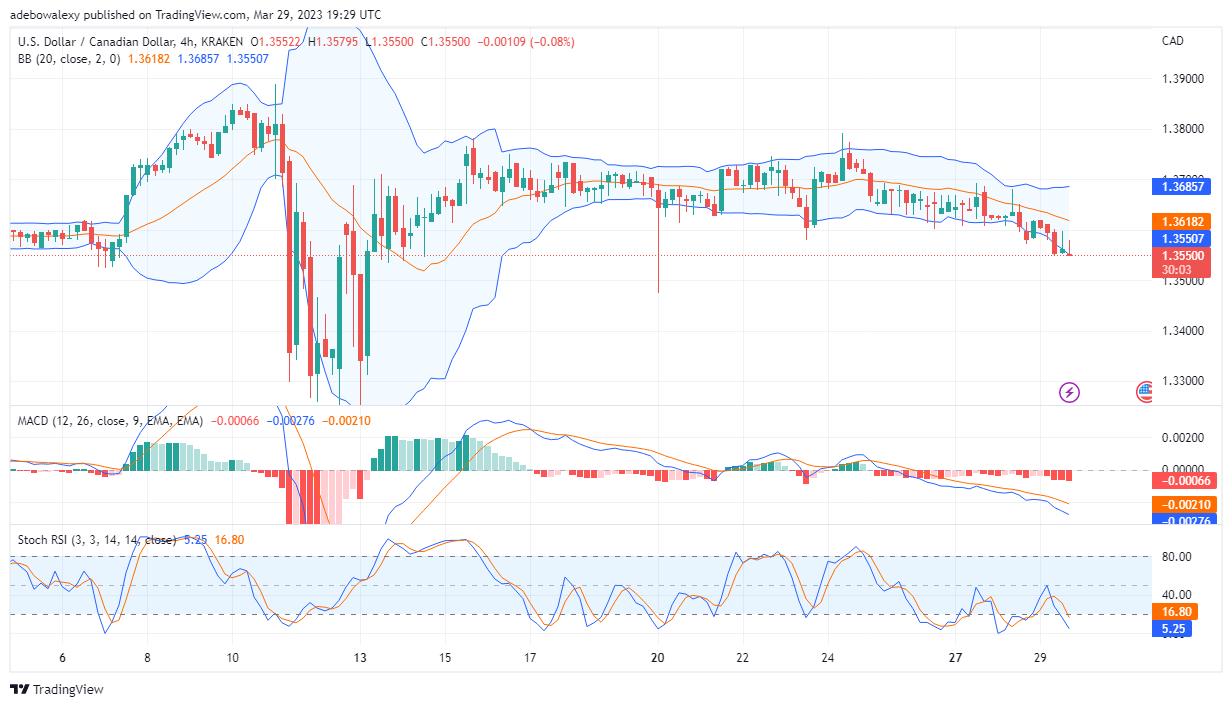
On the 4-hour market, it appears that bulls have tried to break the downtrend, but they aren’t strong enough at this point. A green but inverted hammer price candle appeared for the previous trading session. However, price action seems to continue falling lower in the subsequent sessions. The price candle for this session and the previous one can be seen stuck to the lower limit of the Bollinger Bands indicator. Both the MACD and the Stochastic Relative Strength Index (RSI) indicator keep suggesting that prices remain downside bound. The lines of the two indicators are racing toward lower levels. By implication, price action in this market may retrace the 1.3510 level soon.
Do you want to take your trading to the next level? Join the best platform for that here.


Leave a Reply