The USDCAD price action continues to extend its downward correction, mostly due to a near-static fundamental surrounding the United States Dollar. The market seems to have developed a fair headwind from the CAD side of the market, which has been presenting bear traders with considerable gains, and it seems that more may be on the way.
Major Price Levels:
Resistance Levels: 1.3200, 1.3250, and 1.3300
Support Levels: 1.3166, 1.3100, and 1.3050

USDCAD May Yet Deliver More Profits to Bear Traders
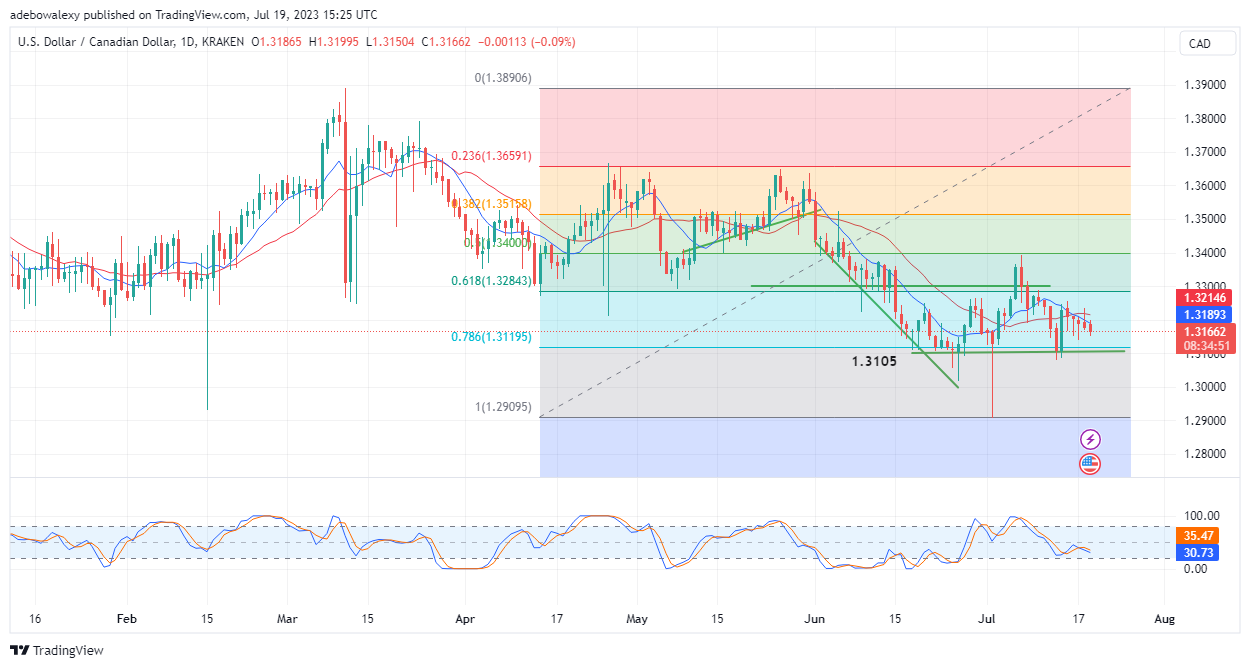
On the USDCAD daily chart, it could be seen that price action is maintaining a downward focus. Bullish traders are left with half of the profit from five trading sessions ago. However, the last price candle on this chart, which represents the ongoing session, is a bearish one and implies that the pair’s price continues to decline.
Additionally, price action in this market continues to occur below the 9- and 21-day Moving Average (MA) curves on this chart. Meanwhile, the Stochastic Relative Strength Index (RSI) indicator lines continue to trend slowly downwards, to portray the current situation of the market. As it stands, more traders may join the side of the headwind, which will continue to force prices downward.

USDCAD Bears Remain on Top
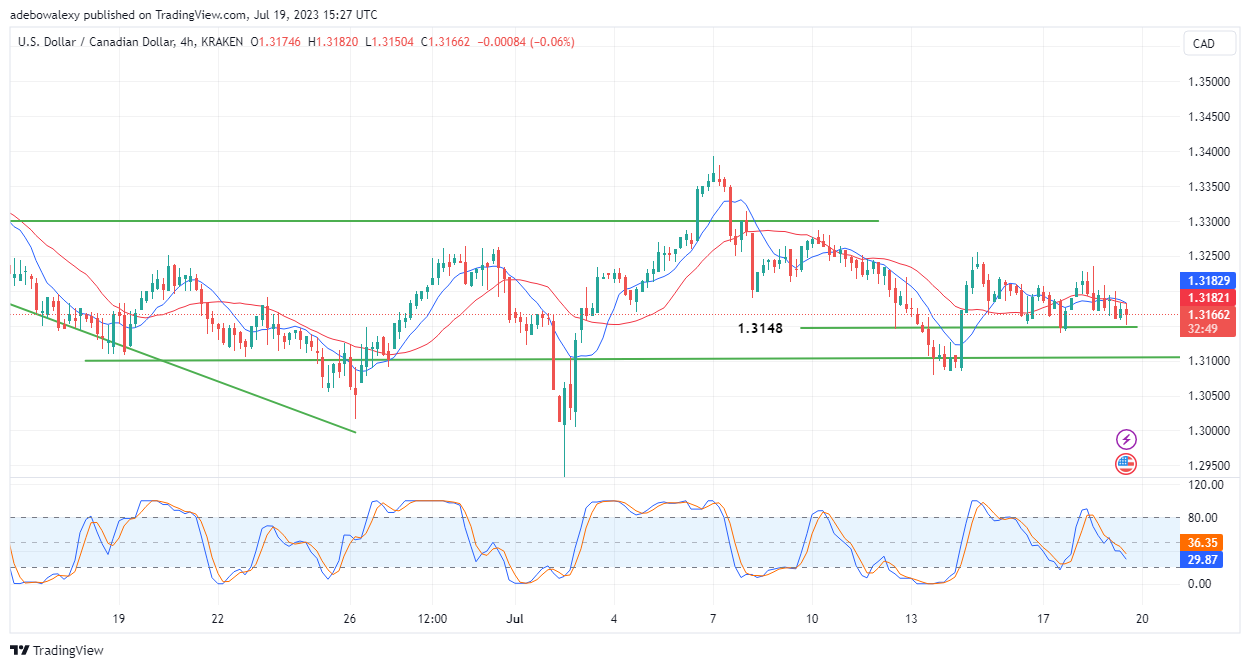
In the USDCAD 4-hour market, it could be seen that price action remains bearish as it remains below the 9- and 21-day MA lines. In the past twelve hours, bulls have tried to refocus on the upside but failed, most likely due to a lack of excitement on the Dollar side.
In this ongoing session, bears have regained dominance, as the latest price candle on this chart is a bearish one while price movements remain under the MA lines. Another indicative fact is coming from the Stochastic RSI as the lines continue to trend downward. Consequently, short traders can anticipate the retracement to continue toward the 1.3148 mark.
.
Do you want to take your trading to the next level? Join the best platform for that here.


Leave a Reply