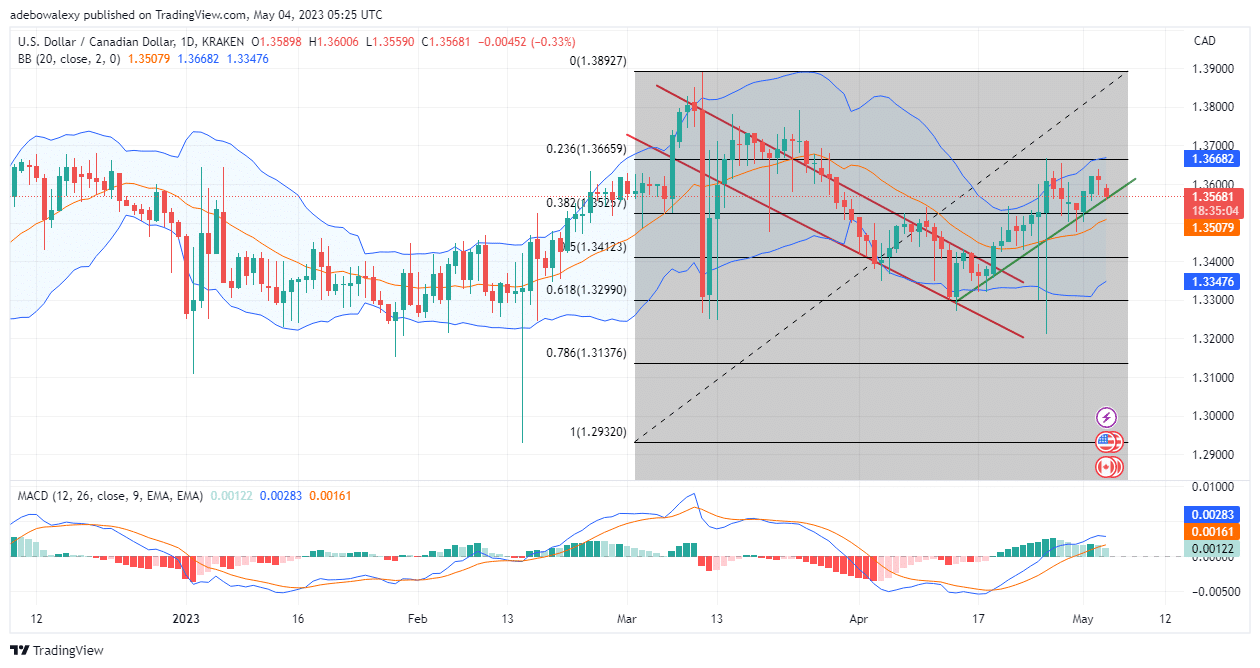
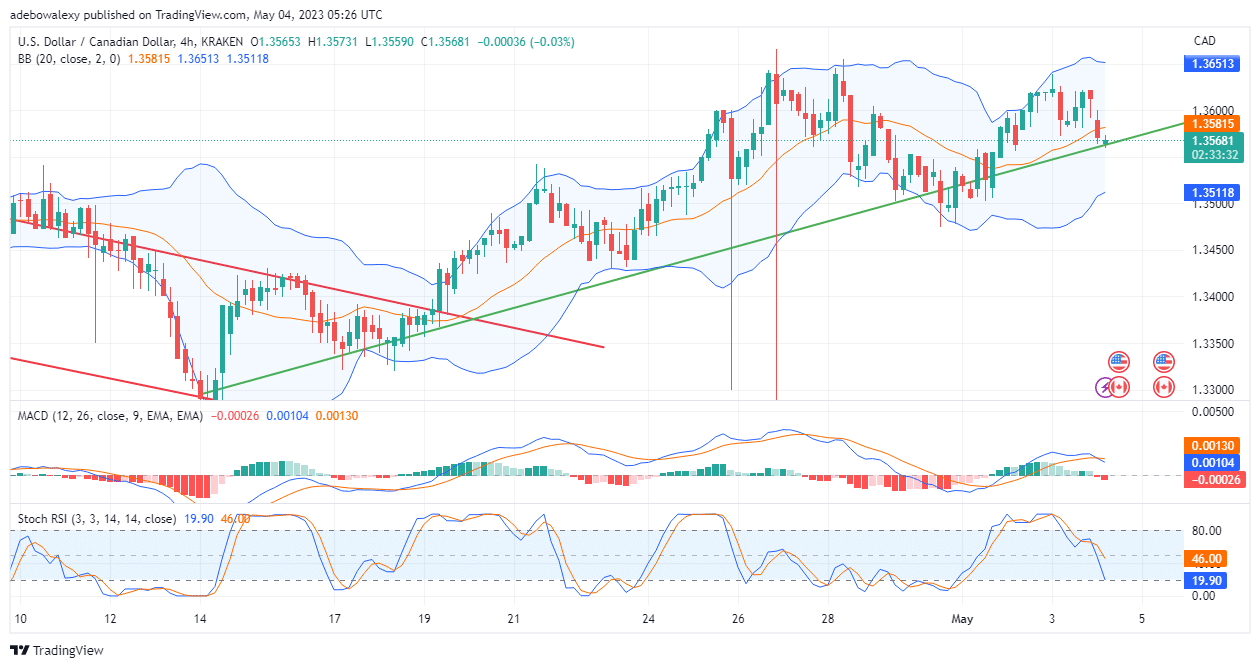
USDCAD price action recently broke upward into the 1.3520 region and has since then continued trading there. Nevertheless, two sessions ago, price action seemed to hit strong resistance, and it subsequently rebounded in the opposite direction. At this point, price action seems to be proceeding toward resistance. Lets examine how this may proceed.
Major Price Levels:
Resistance Levels: 1.3568, 1.3598, and 1.3620
Support Levels: 1.3540, 1.3510, and 1.3480

USDCAD Bulls Are Losing Momentum
Price action in the daily USDCAD market has started retracing downward after poking through strong resistance at 1.3600. Also, since the previous session until now, short traders seem to have been very active. Consequently, this has subjected the pair to a range between 1.3525 and 1.3640. Furthermore, considering the Moving Average Convergence Divergence (MACD) indicator, it is clear that we are growing weaker. This can be seen as the bars of this indicator are now pale green, indicating weakening upside momentum.

USDCAD May Bounce Off Support
In the 4-hour market, it could be seen that price action seems to be preparing for an upside correction. Here, after price action hit the upside-sloping trendline, a green price candle appeared. Consequently, this suggests that an upside correction may be on the way. However, other applied trading indicators arent showing any positive signs yet, as both the RSI and MACD curves keep trending downward following a crossover at a more elevated level. Consequently, traders can only hope that price action develops towards the 1.3581 mark, as this may supply more upside momentum to price action.
Do you want to take your trading to the next level? Join the best platform for that here.


Leave a Reply