Price activity in the USDCAD has continued to occur below the 1.3500 ceiling. Nevertheless, this market has an upside bias, considering indications arising from technical indicators. Let’s conduct more studies on this market for additional insight that could be used to generate a profitable Forex signal.
Key Price Levels:
Resistance Levels: 1.3485, 1.3500, and 1.3600
Support Levels: 1.3450, 1.3400, and 1.3300

USDCAD Bulls May Win the Struggle Above the 1.3450 Mark
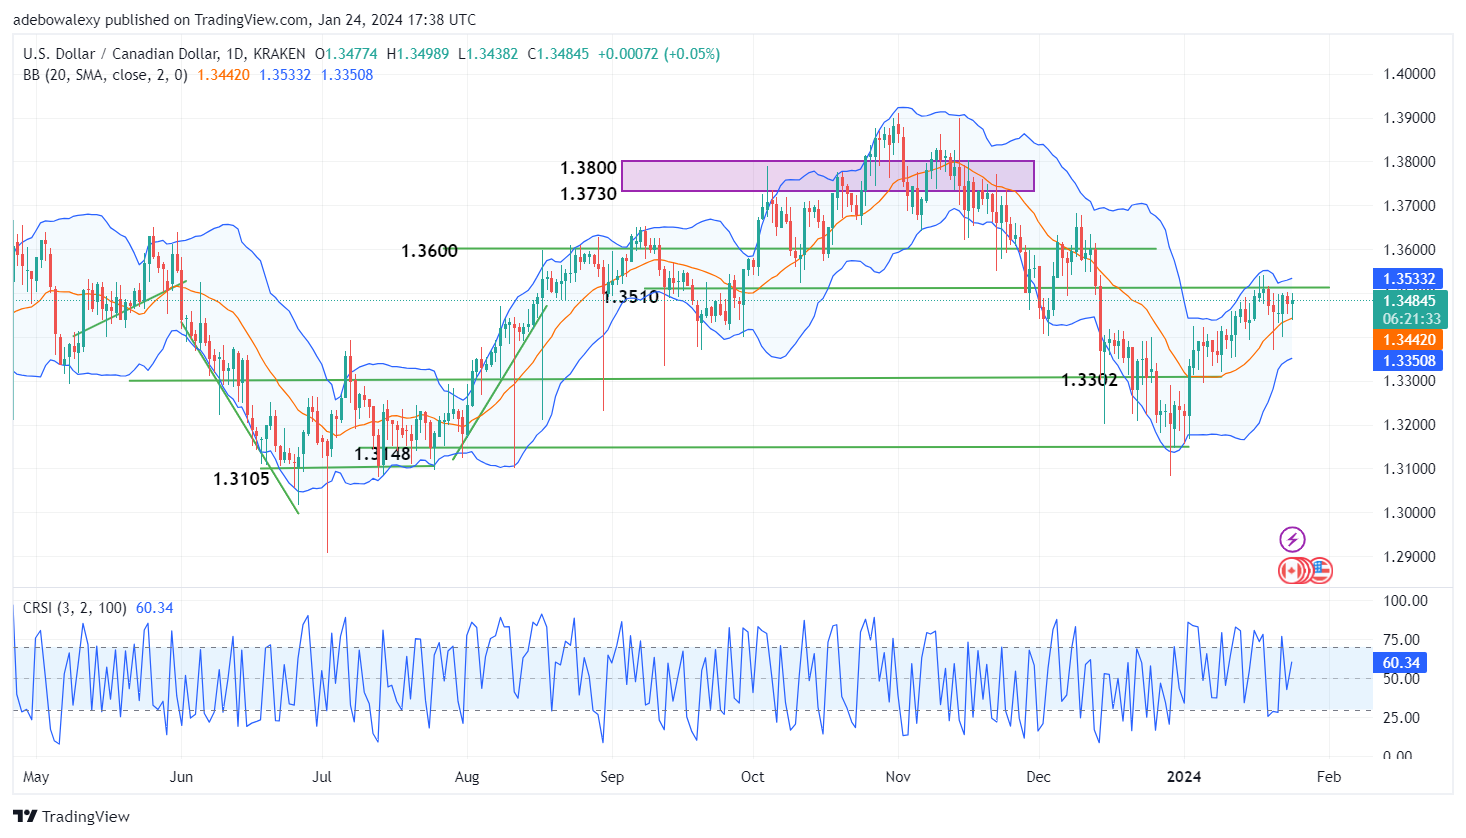
The ongoing session in the USDCAD daily market seems to have been strongly contested between the bulls and bears. Here, it can be seen that the last price candle is green but has a small body, indicating a price contraction. However, the perceived struggle in this market appears to be occurring in a favorable region for the bulls.
The last price candle is standing directly above the middle limit of the Bollinger Bands. Likewise, the Connor Relative Strength Index (CRSI) indicator line is signaling an uptick in bullish momentum in this market. Consequently, this suggests that we may see price action lifting towards higher levels in the coming sessions.

USDCAD Stands Firmly Above a Favorable Baseline
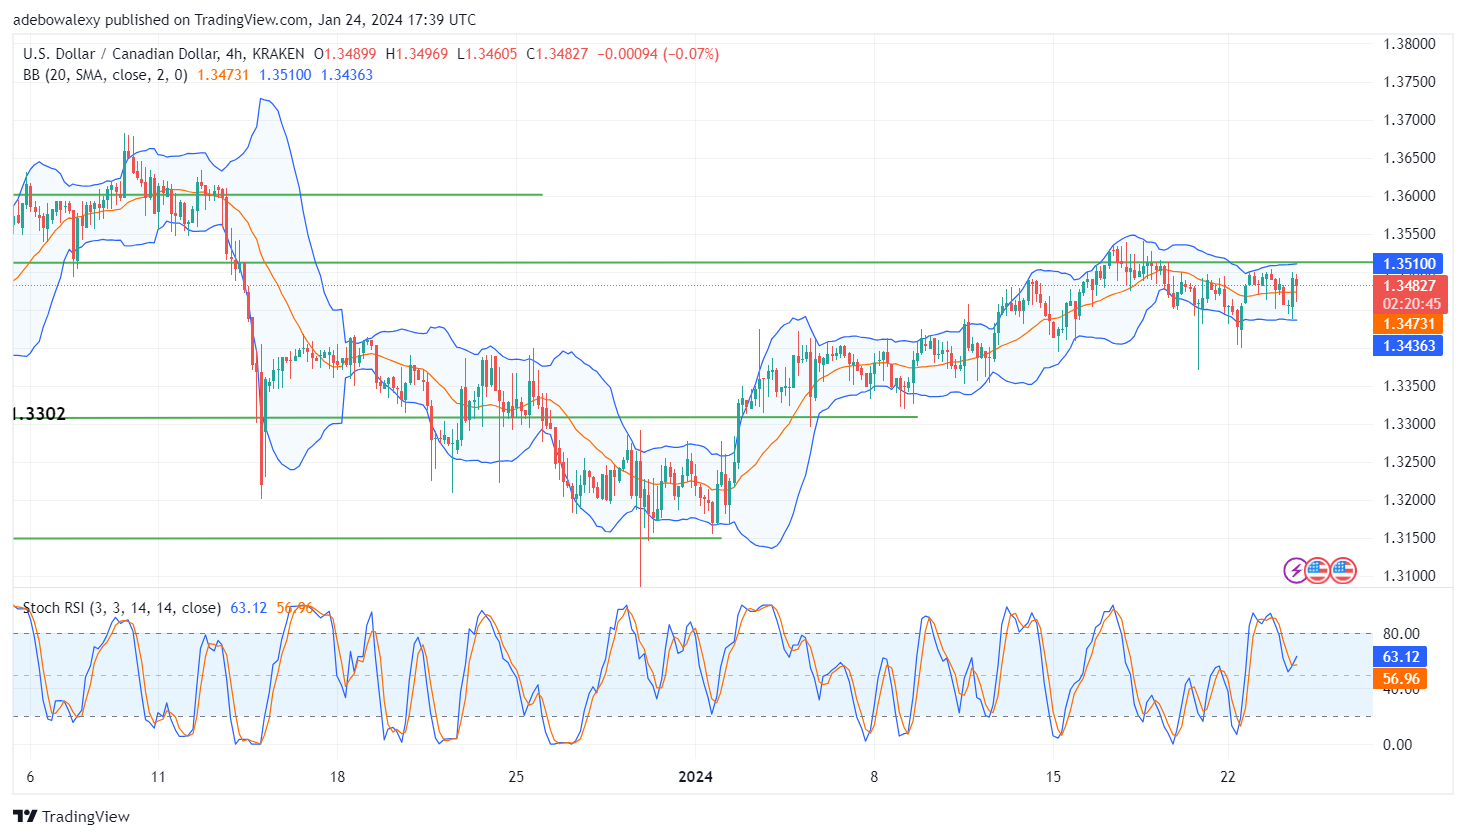
Price action in the USDCAD 4-hour market has shed more light on developments. The current session in this market has presented a downward correction. Yet, the pair continues to trade above the Bollinger Bands MA line, favoring bullish traders as price action can easily continue its upside correction at this front.
Meanwhile, the Stochastic Relative Strength Index (RSI) indicator line has delivered a bullish crossover above the 50 threshold level. This affirms that bullish momentum will most likely strengthen, and prices may eventually extend the upside correction through the 1.3500 mark.
Do you want to take your trading to the next level? Join the best platform for that here.


Leave a Reply