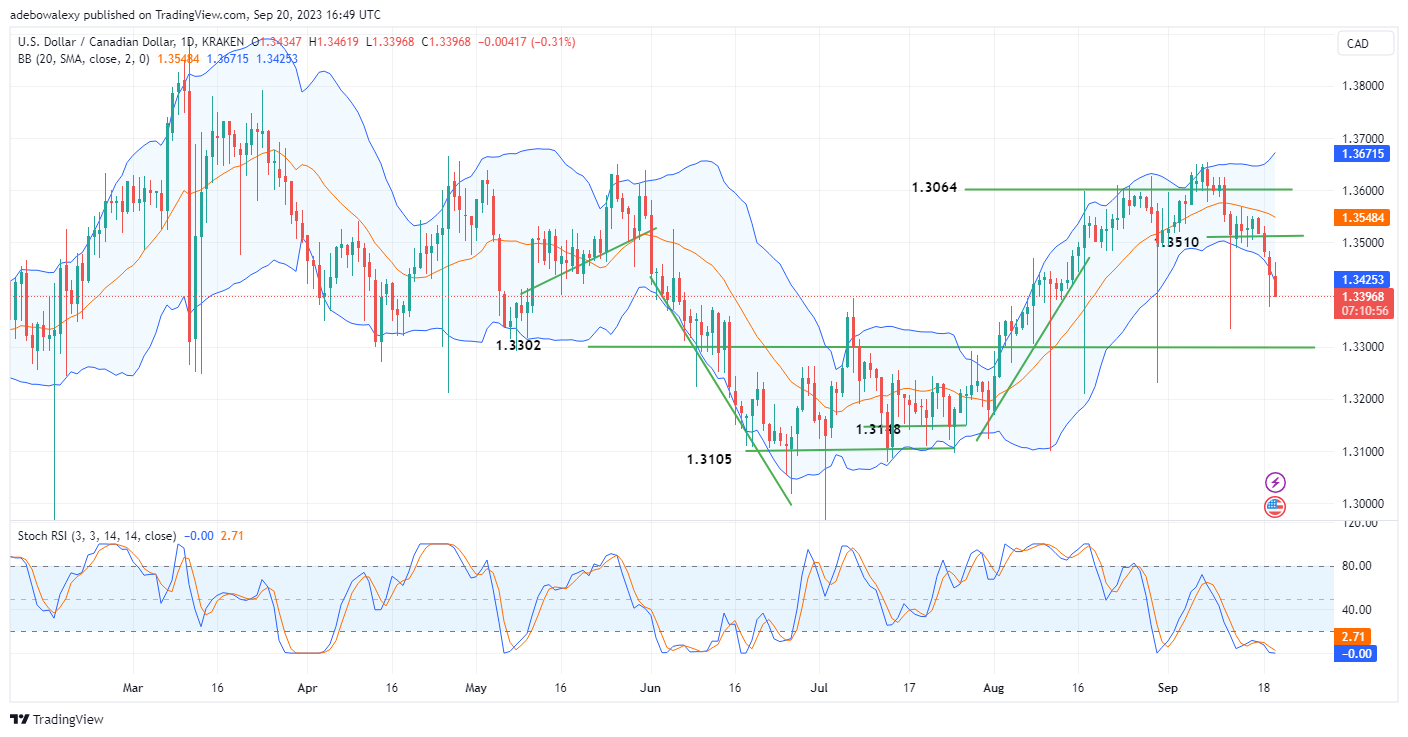
The US dollar was unimpressed by last weeks fundamentals, while this week has brought more dismal performance to the buck. This has created a strong headwind in the USDCAD market, as price action corrects sharply towards lower support levels.
Major Price Levels:
Resistance Levels: 1.3400, 1.3500, and 1.3600
Support Levels: 1.3396, 1.3300, and 1.3200

USDCAD Price Action Trickles Towards Support at 1.3302
Ever since the beginning of this weeks trading activities, USDCAD has been strongly bearish. Price action in this market has pushed and is still pushing the lowest limit of the Bollinger Bands. Normally, a rebound could have occurred in the opposite direction.
Nevertheless, it appears that more buyers of the pair from the 1st of August are joining the downtrend. Also, the Relative Strength Index indicator lines have fallen deep into the oversold region. As a result, technical indicators may stimulate more traders to keep going short, which will keep dragging price action to lower support.

USDCAD May Keep Offering Bear Trader More Profits
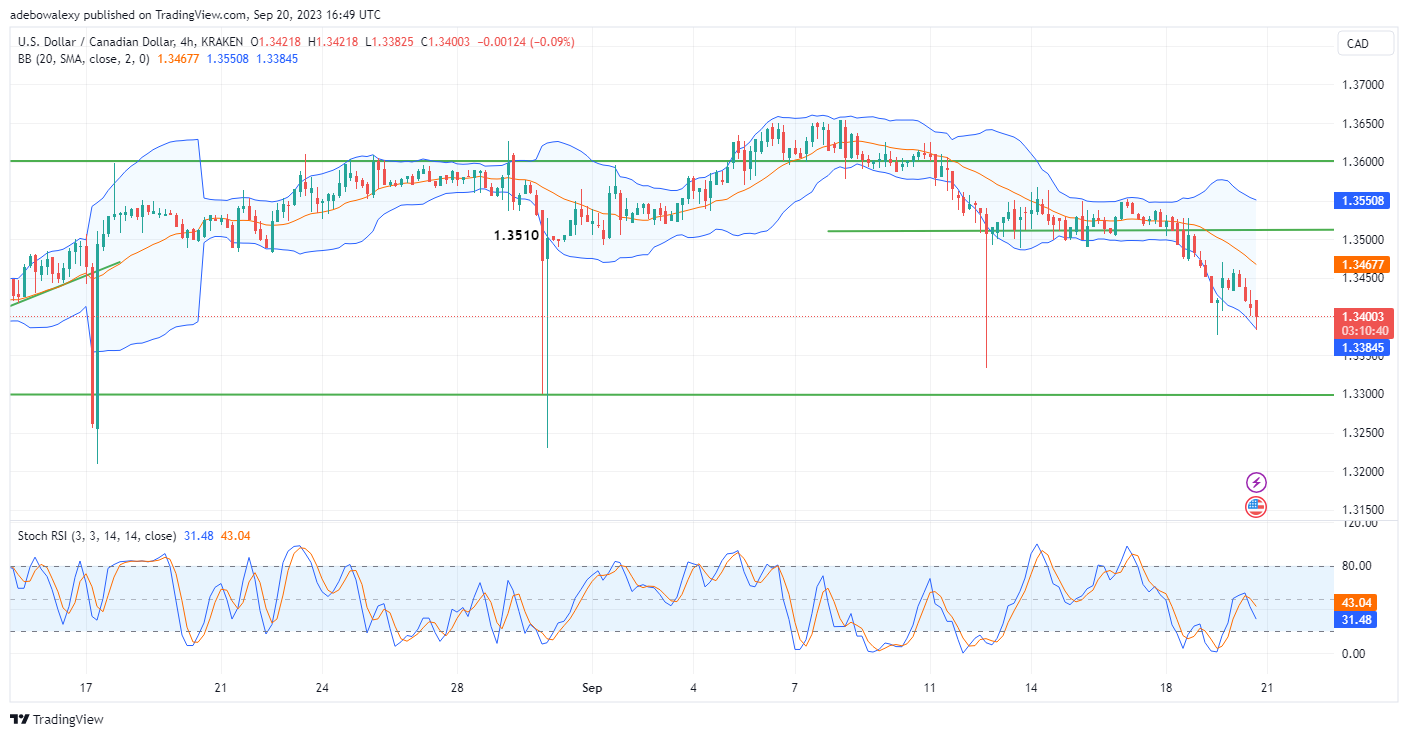
Even in a shorter time frame of 4 hours, the USDCAD pair looks strongly bearish. At this point, bulls seem to have exited the market. Price action continues to trickle down by way of the lowest limit of the Bollinger Bands.
Likewise, the Relative Strength Index (RSI) recently delivered a bearish crossover very near the 50 level of the indicator. Since then, the lines of the RSI have maintained a downward path. Consequently, trading indicators maintain that price action is eying the 1.3300 mark for support.
Do you want to take your trading to the next level? Join the best platform for that here.


Leave a Reply