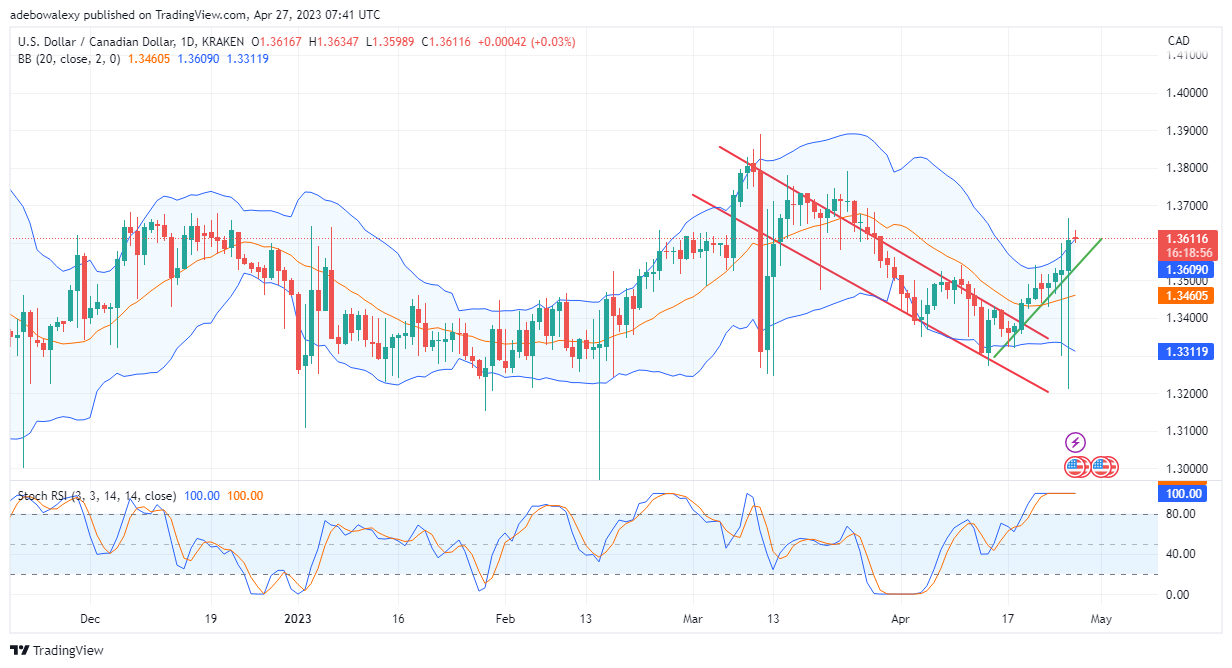
The USDCAD pair seems to have gained some favorable fundamentals surrounding the US dollar. Price action in this market suddenly ramped past the 1.3600 mark, to now stand at 1.3612. Technical indicators are still on a positive bias about more upside moves in this market.
Major Price Levels:
Top Levels: 1.3620, 1.3660, and 1.3690
Floor Levels: 1.3612, 1.3600, and 1.3580

USDCAD Price May Have Started An Uptrend
Either the Canadian dollar is losing strength. Or the US dollar is gradually gaining strength, USDCAD price action on the daily chart seems to have started an uptrend. The ongoing trend started when price action bounced upwards from nearly 1.3312. At this point, price activity now occurs above the middle limit of the Bollinger Bands indicator. Also, the Relative Strength Index (RSI) indicator lines have reached the peak of the overbought region and seem ready to drag in that region. By implication, this suggests that the upside trend is considerably strong.

Upside Hopes Stay On in the USDCAD Market
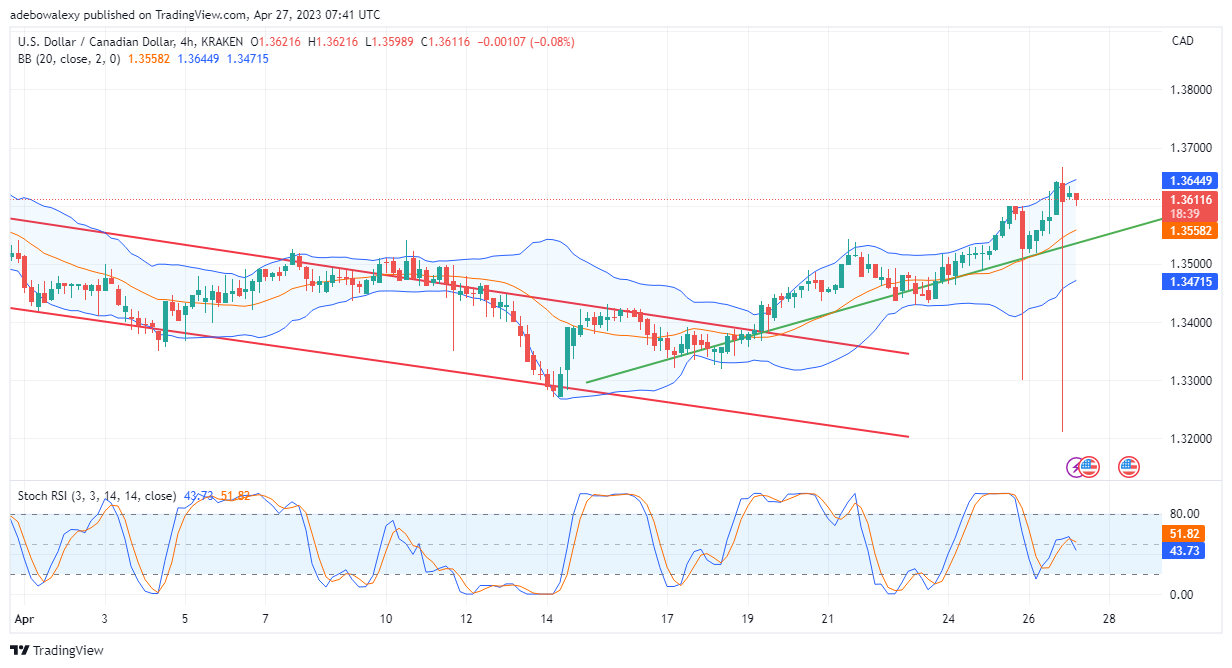
On the 4-hour chart, one can observe that price action keeps trading about the middle limit of the Bollinger Bands. Consequently, this suggests that price action is still favorably positioned for more gains. However, the RSI curves seem to have given a bearish crossover below the 55 levels of the indicator following the last red candle on this chart. Yet it stands that more traders can join the trade even if the USDCAD price retraces the 1.3600 mark. Consequently, traders can still anticipate that price action will retrace toward the 1.3700 mark.
Do you want to take your trading to the next level? Join the best platform for that here.


Leave a Reply