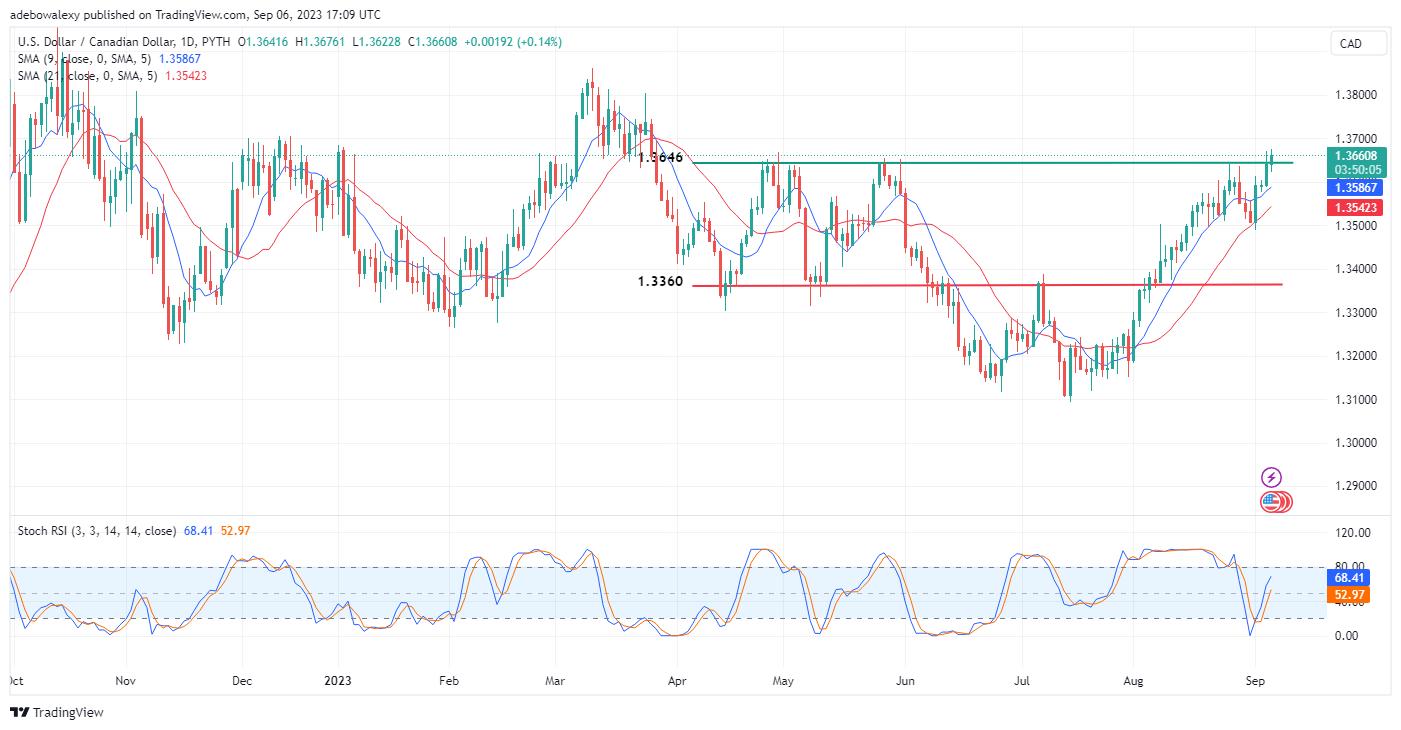
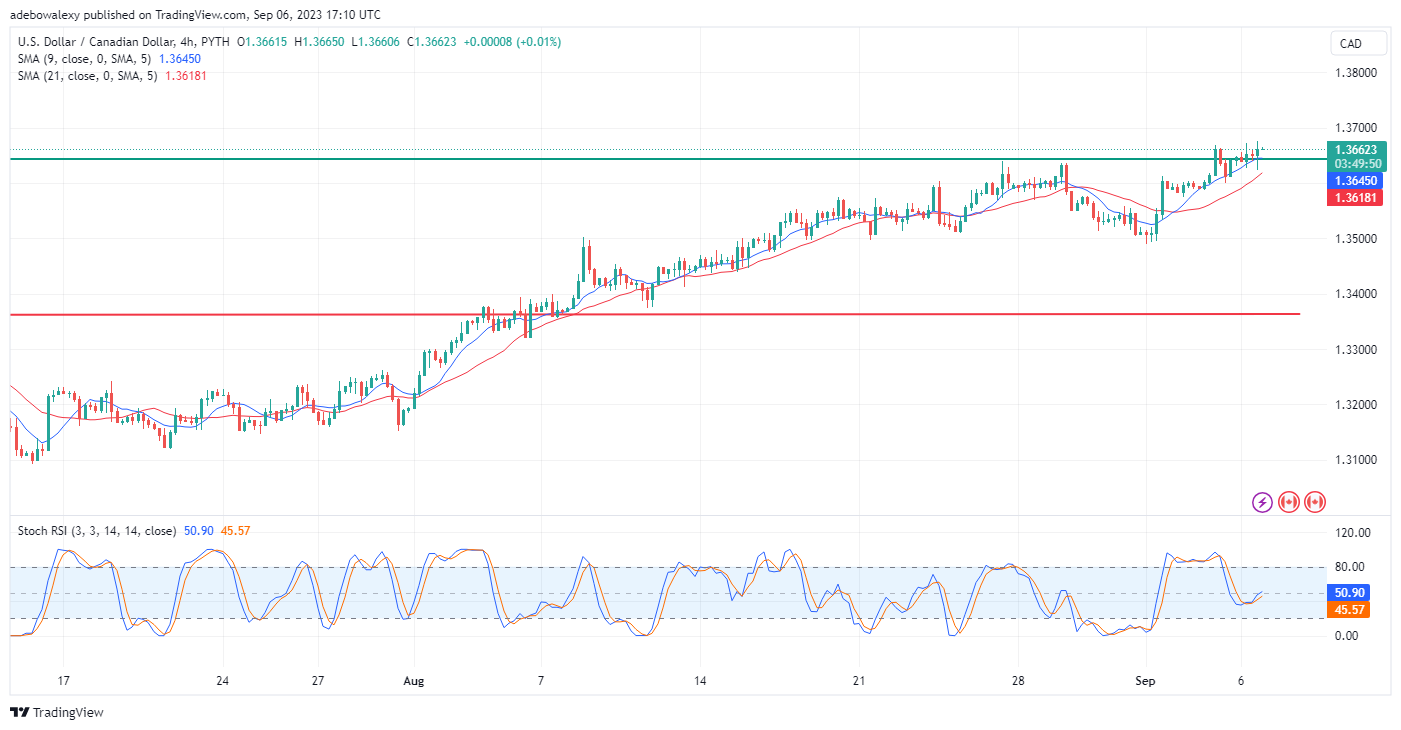
Price action in the USDCAD market had earlier corrected off the 1.3646 resistance mark during last week’s trading activities. But the pair had resumed gathering profits since the beginning of this week’s trading. This saw prices pop through the ceiling at the 1.3646 mark, which was once a respected price level.
Major Price Levels:
Resistance Levels: 1.3661, 1.3700, and 1.3750
Support Levels: 1.3611, 1.3566, and 13516

USDCAD May Obtain Support Above the 1.3606 Mark
It could be seen that price action in the USDCAD daily market has been bullish since the start of this week. This seems to have been an extension of the uptrend that started on August 1. At this point, price action has broken the 1.3606 mark and still remains bullish, going by technical indications.
The Stochastic Relative Strength Index (RSI) curves are still trending towards the overbought region. Also, it could be seen that the behavior of the RSI is proportional to price movements. While trading activities continue to occur above the Smooth Moving Average (SMA) curves, it appears that price action may soon find support above the broken resistance.

USDCAD Continues to Close in on the 1.3700 Mark
The USDCAD 4-hour market has revealed that price action is progressing to the upside already. This can be seen because buyers have been gathering minimal profits above the 1.3646 mark. Additionally, a new session has begun above this mark, which increases the chances of further upside advancements.
Meanwhile, the RSI curves are still rising. The leading line of this indicator has just crossed the 50 mark following a crossover. By observing price behavior in this market, it is revealed that price action seems consistent and proportional to price increases. Therefore, the uptrend may gather traction towards the 1.3750 mark.
Do you want to take your trading to the next level? Join the best platform for that here.


Leave a Reply