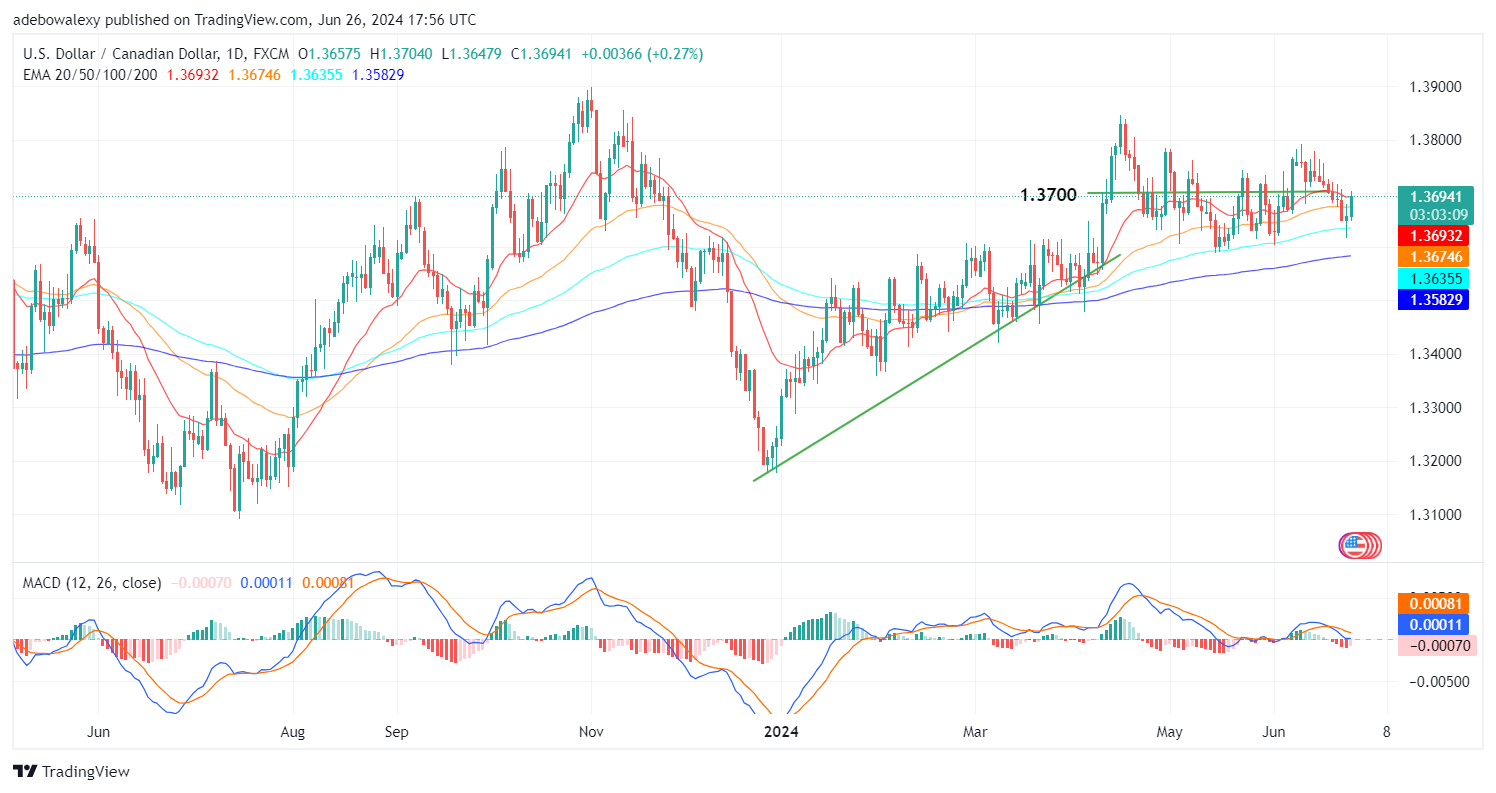
Trading activity today in the USDCAD market has been particularly profitable. The bullishness seen in this market seems to have its roots in the intense buying of the greenback. However, the Note Auction data seems to have arrived lower than the previous one and may introduce some corrections to this pair.
Key Price Levels:
Resistance Levels: 1.3700, 1.3800, and 1.3900
Support Levels: 1.3600, 1.3500, and 1.3400
USDCAD Pips Through the 20-Day EMA
Buyers in the USDCAD market have recorded one of the most active sessions in recent times. This happened after the market rebounded off the support of the 100-day Exponential Moving Average (EMA) line. The last price candle here can be seen placing the price of the token above all the EMA curves, which favors the development of more bullish momentum.
Meanwhile, the Moving Average Convergence Divergence (MACD) indicator lines have just made a U-turn at the equilibrium level. Likewise, the last bar of the MACD is now pale red, indicating that downward forces have been affected by the notable upside correction seen in the ongoing session. This may eventually stimulate buying confidence in this market.
USDCAD Faces a Rejection But Appears to Retain Its General Trajectory
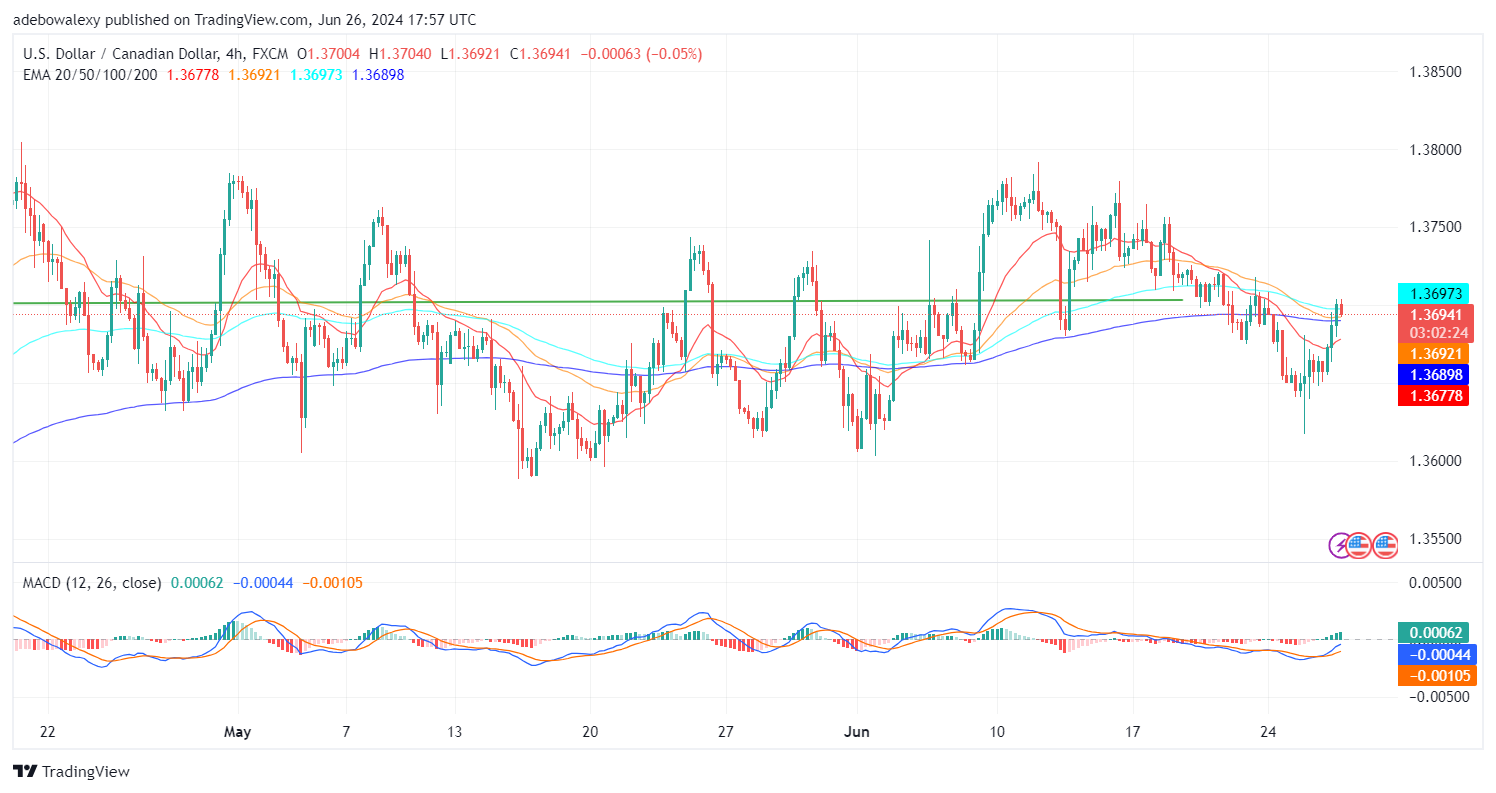
The USDCAD 4-hour market has posted that some negative correction has occurred in this market today. This can be seen through the last price candle on the chart above. The mentioned price candle can be seen bringing prices below the 100-day EMA line. Nevertheless, the pair keeps trading above the 20, 50, and 200-day EMA lines.
The MACD indicator lines can also be seen maintaining their upside trajectory despite the minimal downward correction. Likewise, the momentum still seems healthy, judging by the appearance of the MACD indicator. Provided that the market can shake off the negative sentiment that may arise from the poorer-than-expected Note Auction data, the market may proceed towards the 1.3750 mark.
Do you want to take your trading to the next level? Join the best platform for that here.


Leave a Reply