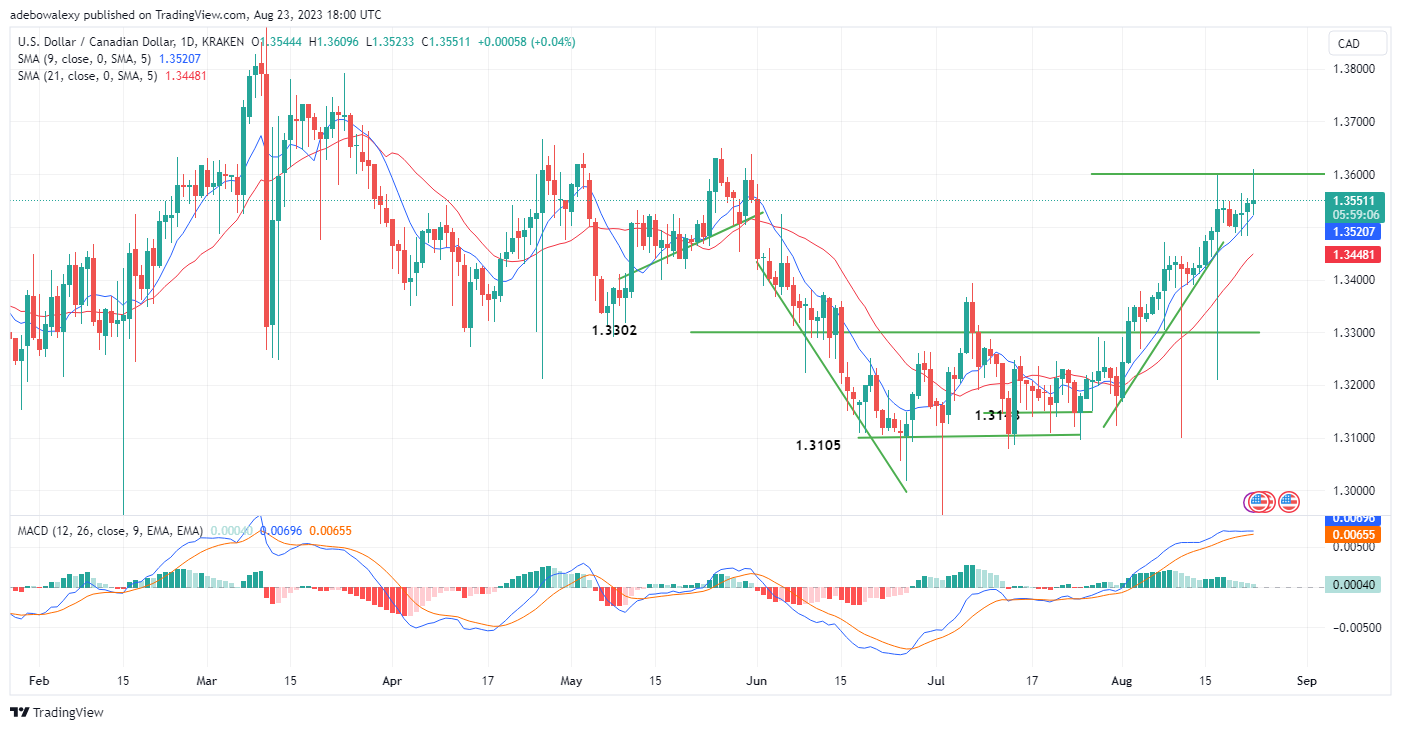
The momentum surrounding the USDCAD medium-term upside price retracement has started cooling. This started not long after price action crossed the 1.3500 threshold. Although bulls continue to appear favored in this market, it could be profit-saving to take note of the weakening momentum.
Major Price Levels:
Resistance Levels: 1.3551, 1.3600, and 1.3650
Support Levels: 1.3500, 1.3450, and 1.3400

USDCAD Tests the 1.3600 Mark but Lacks the Confidence to Break it
Trading activities in the USDCAD market continue to take place above the 9- and 21-day Smooth Moving Average (SMA) curves. Even the price candle for the ongoing session has tested the price resistance level at the 1.3600 price mark. However, it could be seen that the body of the price candle soon pulled back towards the seller’s side of the market.
In addition, the Moving Average Convergence Divergence MACD indicator lines have turned sideways, indicating a lowering of momentum. Although still appearing bullish, the last price candle continues to indicate that headwinds are considerably influencing the market.

USDCAD Failing Momentum Becomes Visible
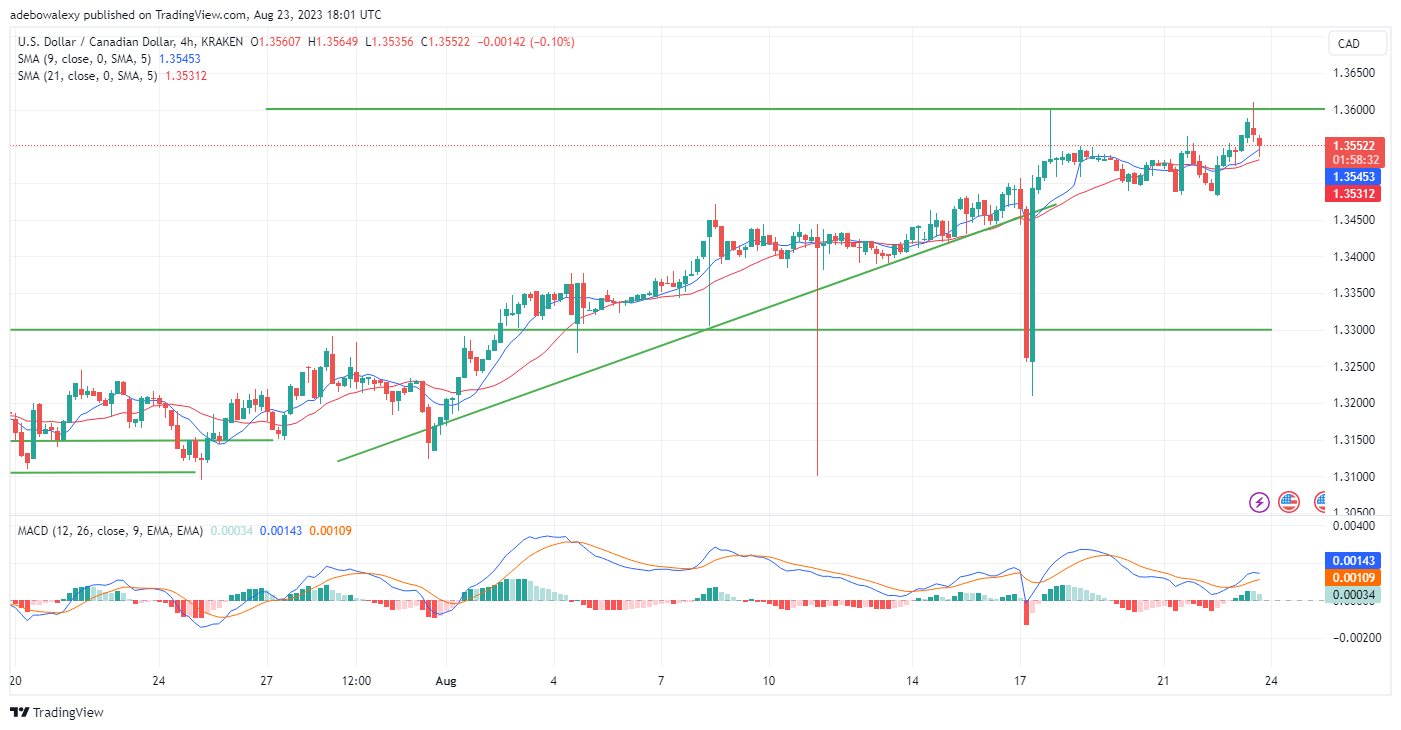
As noted, lowering momentum in the USDCAD market has been clearly portrayed on the 4-hour price chart. Price action has corrected off the resistance levels at the 1.3600 price mark since the previous trading session. Also, the ongoing session has even advanced the downward correction, as a red price candle has appeared to represent it.
Additionally, the leading line of the MACD indicator has corrected sideways following the recent developments. Although price action remains above the equilibrium SMA lines, it could be seen that bears are already influencing price movements. Therefore, traders can anticipate a downward correction towards the 1.3500 mark in a short while.
Do you want to take your trading to the next level? Join the best platform for that here.


Leave a Reply