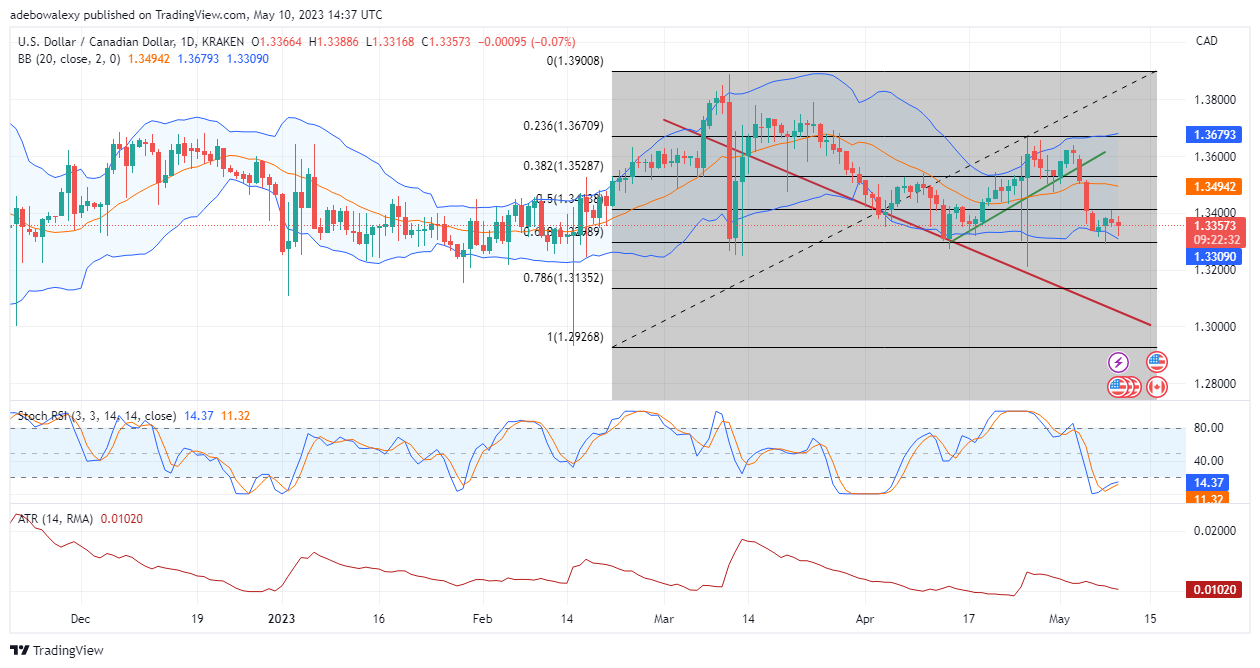
USDCAD triggered downward forces after it attempted to retrace the price mark of 1.3400. Going forward, indications from this market suggest that more downward retracements may occur. Consequently, let’s examine how this may proceed.
Major Price Levels:
Resistance Levels: 1.3320, 1.3360, and 1.3400
Support Levels: 1.3298, 1.3258, and 1.3208

USDCAD Eyes Support at the 1.3298 Price Mark
For the second session, price action in the USDCAD market has remained in the hands of bear traders. As a result, the recent price increase from four trading sessions ago has been significantly trimmed. The last price candle on this chart has pushed the pair’s price to 1.3357. By closely examining the Stochastic Relative Strength Index (RSI) curve, one can see that the distance between the leading and lagging lines is small. In addition, the terminal of this curve seems to be preparing for a bullish crossover. Consequently, this suggests that price action may retrace lower.

USDCAD Price Action Punches Through a Key Support
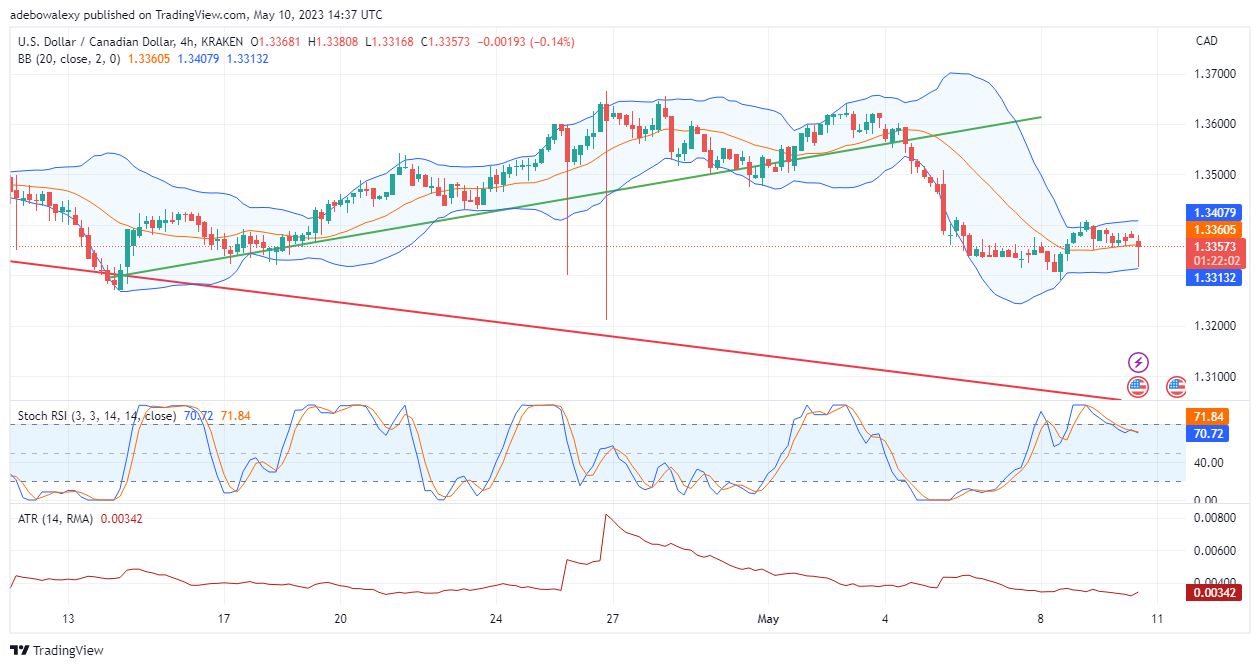
Coming to the 4-hour market, it could be seen that the last price candle here seems to have pinched its way through the middle band of the applied Bollinger Bands indicator. Likewise, the curves of the RSI now have a downward bearing, while its lines are heavily interwoven above the 70 levels of the indicator. Nevertheless, the lines of the Average True Range indicator (ATR) seem to be contrary to this opinion. This is because the terminal of this indicator line seems to be projected upward. Therefore, traders may have to go with the majority of the technical indicators and anticipate a retracement of the 1.3298 price mark.
Do you want to take your trading to the next level? Join the best platform for that here.


Leave a Reply