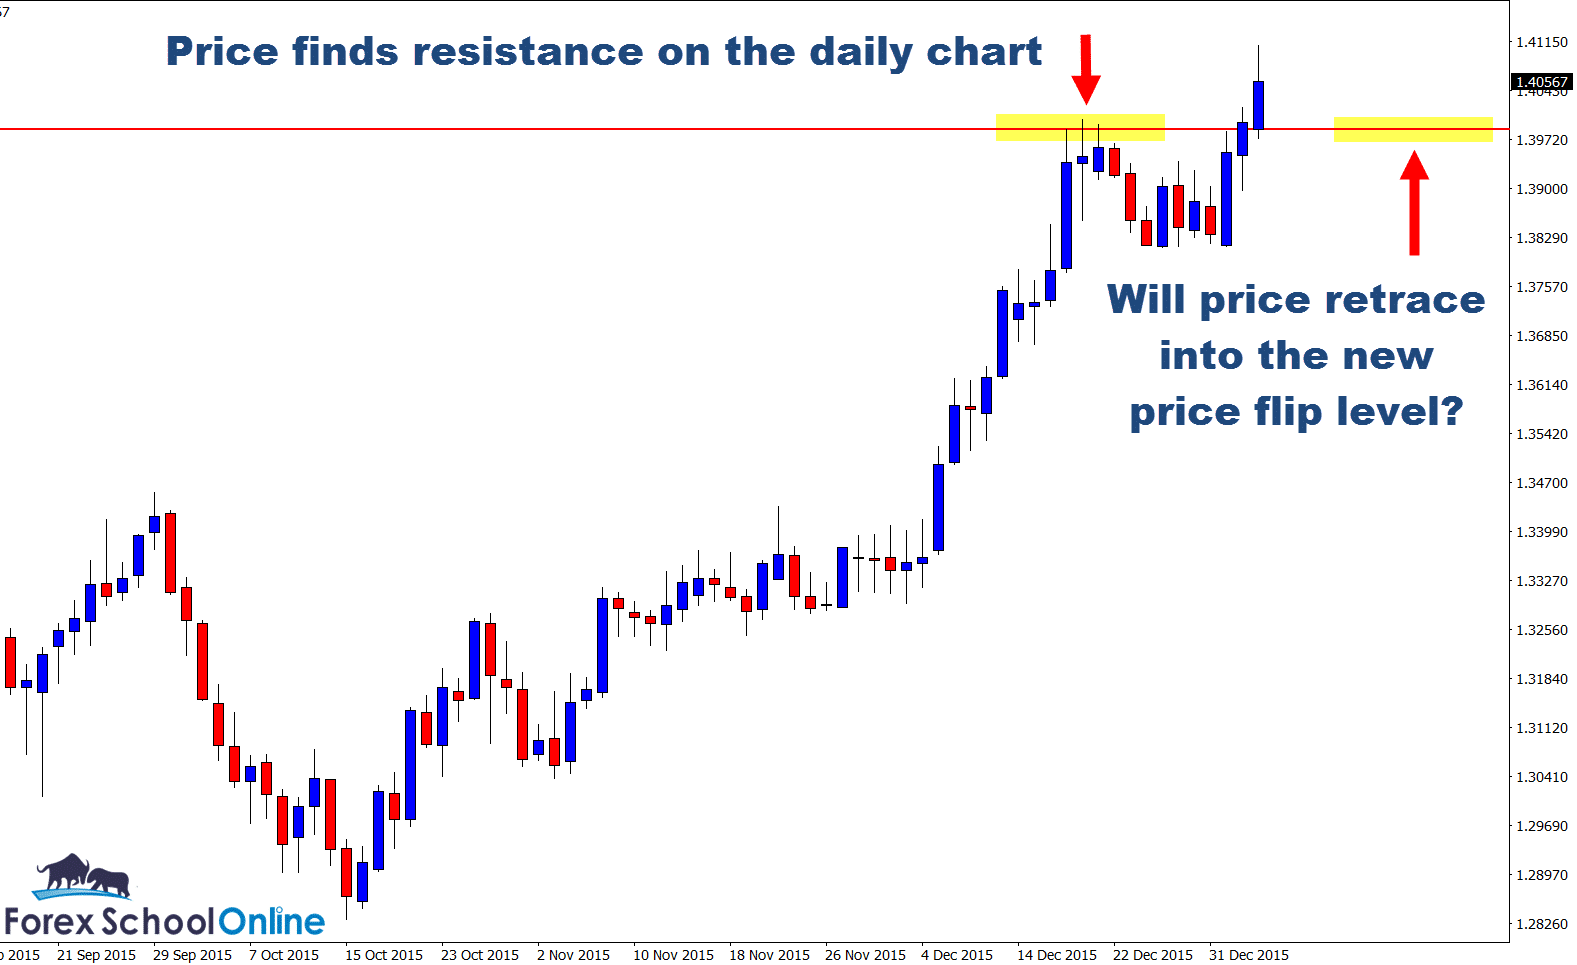
The USDCAD has smashed higher and through a major weekly and daily price flip resistance level. If you move to your weekly price action chart and zoom it right out you will see that this level that I have marked on my chart below is a major level that has been respected going back now well into the mid 90s.
A question I get asked regularly about support and resistance levels by traders is; how far back should traders be looking for their levels and how do traders put together the overall price action story with the longer term and shorter term support and resistance levels.
The answer to these questions is; you need to take into account all levels. Now I bet you have just read the answer and thought to yourself “But surely that means there will be levels everywhere and how on earth can I possibly trade with levels sometimes going back into the 90s!”.
It really is a lot simpler than it at first seems. As you have already seen above on the weekly chart of the USDCAD; the longer term levels are just normal support and resistance levels and they act the EXACTLY same way. What does this mean? It means that when price approaches them in the short-term, price will quite often respect them, reject them or hover around them and this is why you get what we have on the USDCAD weekly chart where the price action is moving into the same level as price did almost 20 years ago.
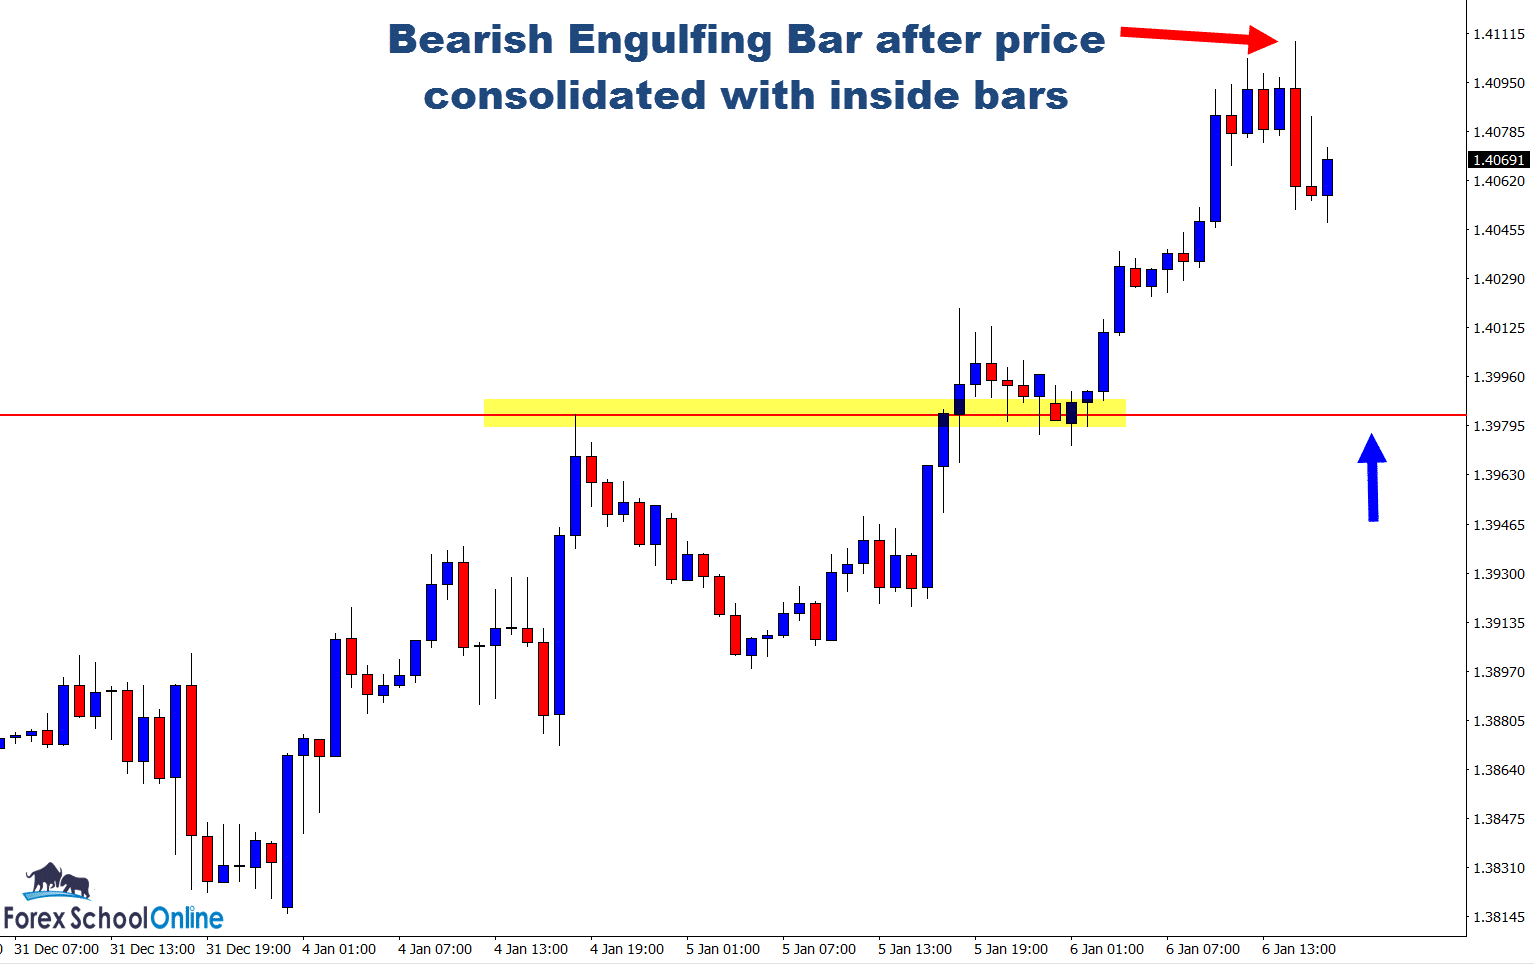
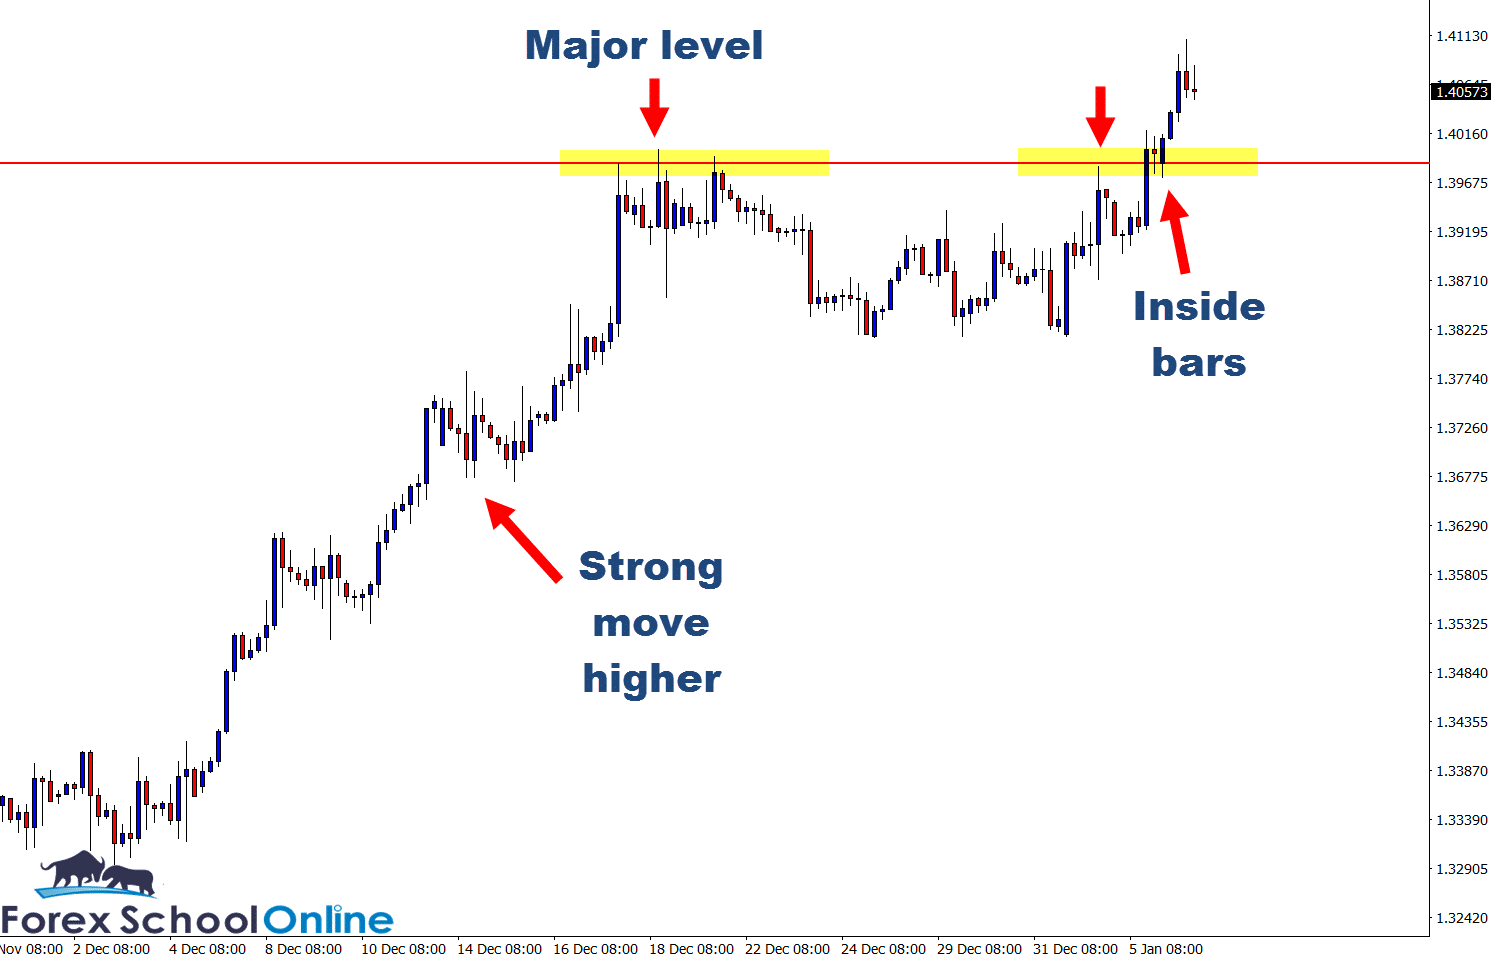
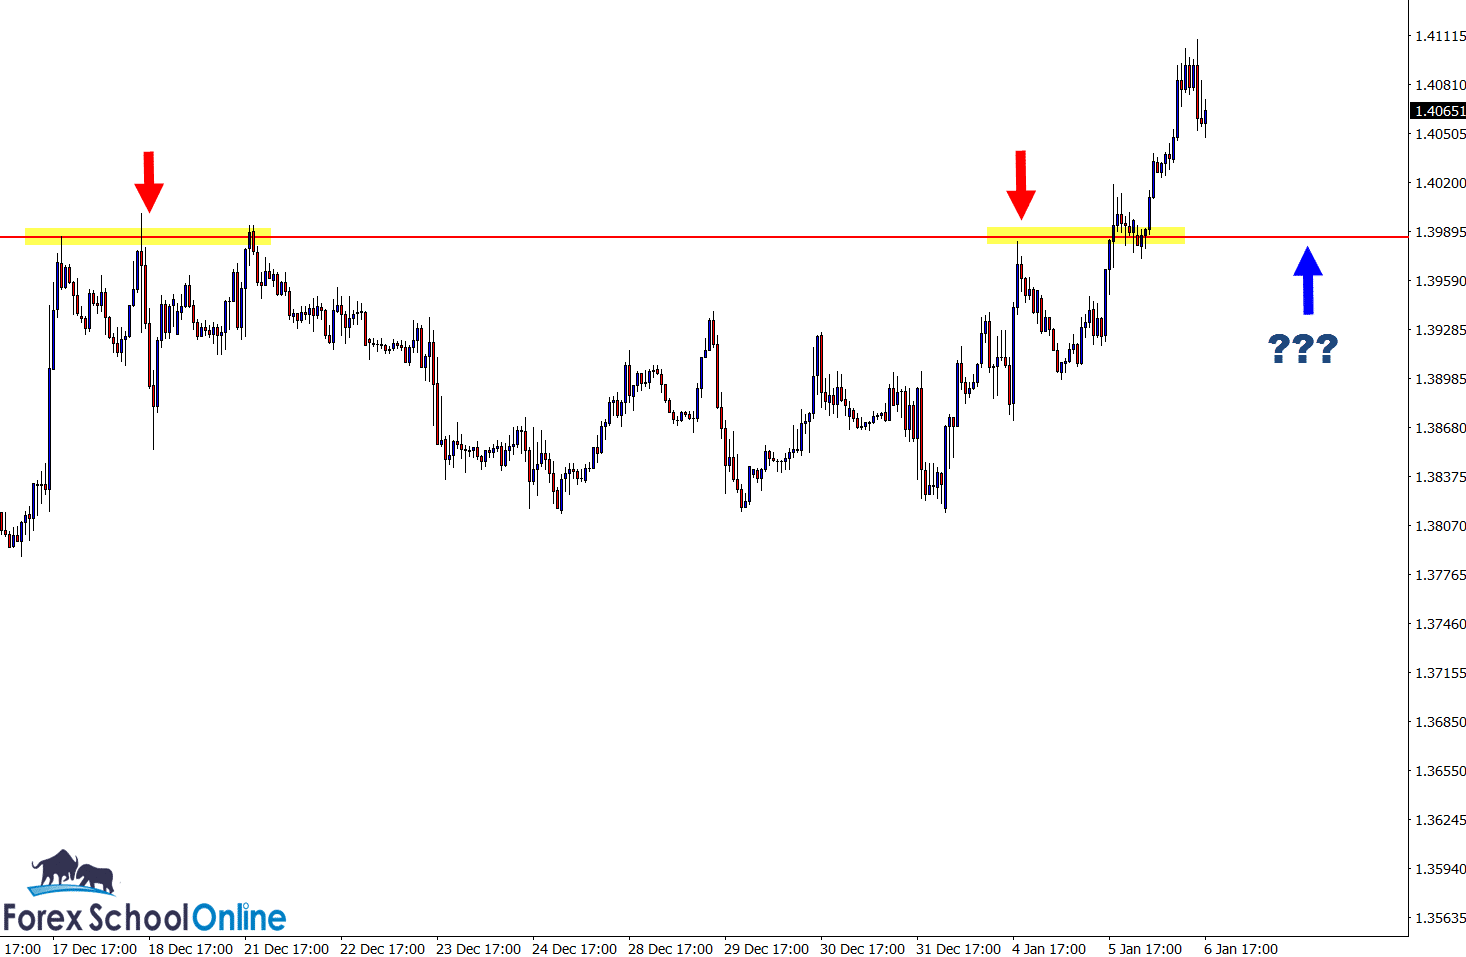
Now that price has broken higher and closed strongly above this daily resistance level, we can look to take long trades for as long as price remains above the major level. On the 4 hour chart below; I have marked the “Kill Zone” that could act as a really high probability area to hunt long trades should price make a quick retrace lower and back into the old resistance and potential new support area.
Any potential long trades would have to be confirmed with a A+ high probability trigger signal like the ones taught in the members only price action course.
In the trading strategy lesson Making Super High Probability Trigger Signals From Kill Zones I discuss how exactly you can hunt trades that are with the trend and at major key support or resistance levels and also how you can get into the trade setups on the intraday time frames.
Daily Chart – Major Daily Level

4 Hour Chart – Inside Bars
1 Hour Chart – Zoomed Out
1 Hour Chart – Zoomed in


Leave a Reply