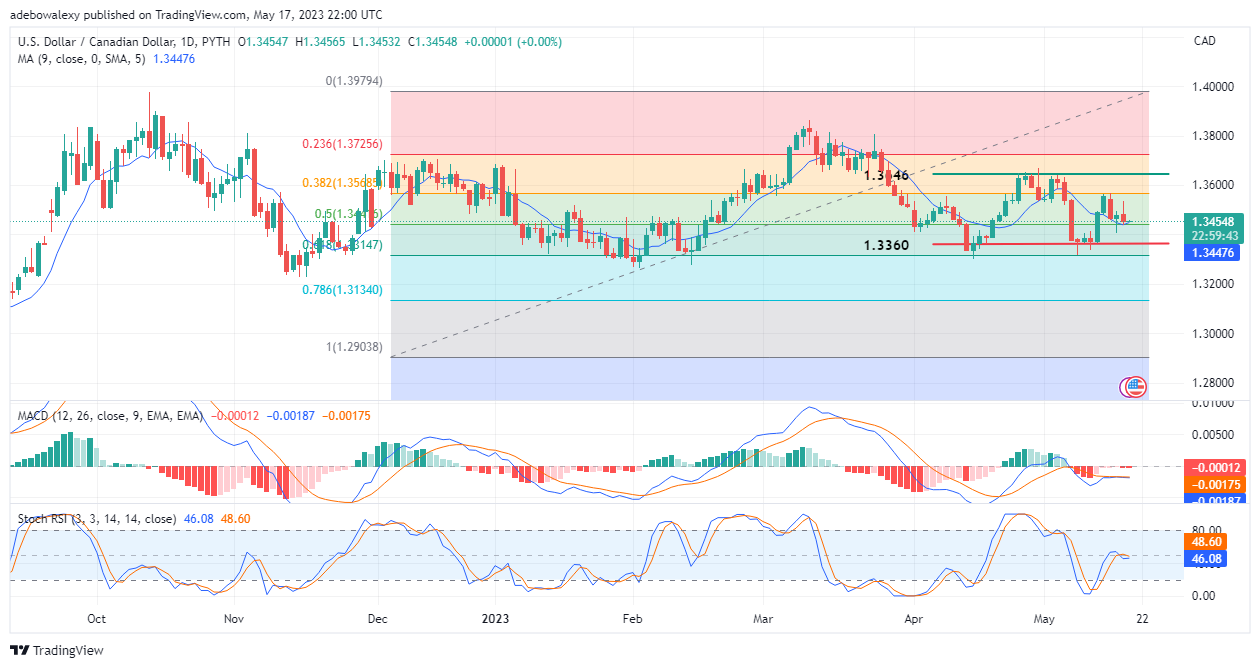
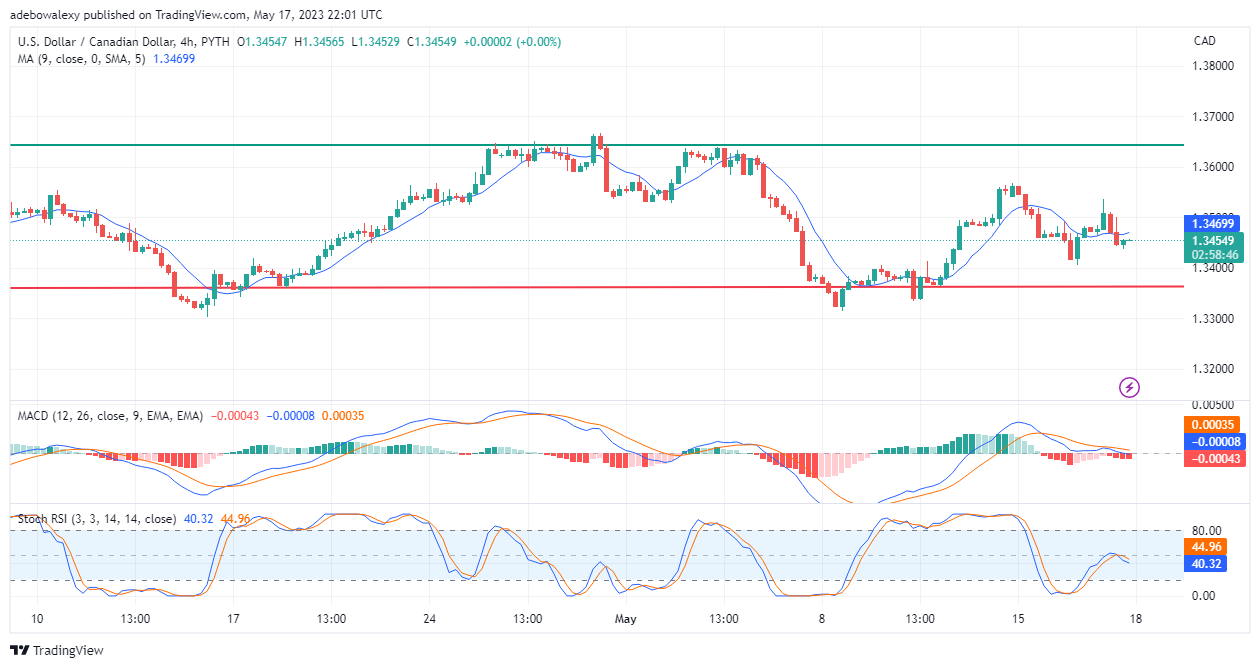
The USDCAD price has been oscillating between the support and resistance levels of 1.3646 and 1.3360. Currently, price action in this market seems to be trying to settle above 1.3445. The above-mentioned point seems like an important support for technical indicators applied to this market. Let’s see how price movements may behave at this point.
Major Price Levels:
Resistance Levels: 1.3454, 1.3478, and 1.3500
Support Levels: 1.3434, 1.3414, and 1.3400

USDCAD Is Trying to Gain Traction Above the 9-Day Moving Average
Price action in the USDCAD market has been acted upon by headwinds from unfavorable fundamentals in recent trading sessions. However, this pair seems to have found some strength with which it’s trying to abate the most recent downward retracement. A green dashed-shaped price candle has appeared just above the 9-day Moving Average line. Also, the Stochastic Relative Strength Index (RSI) indicator lines can be seen moving closer to each other at the terminal for an upside crossover. It appears that a bettering fundamental on the USD front is already influencing price movements.

USCAD Looks Bearish But Not Without Some Upside Hopes
Technical indicators on the USDCAD market maintain a bearish tone as price action stays below the 9-day MA curve. However, in the previous session, traders had been recording minimal profits. Furthermore, another green price candle with a short body, which has just appeared in this market, may develop towards the MA line. Nevertheless, the lines of the MACD and RSI are trending downwards to indicate that price action is bearish. Traders should note that the distance between the Stochastic RSI lines is small, and a crossover may occur if the price develops towards the MA line. Consequently, traders can anticipate a retracement of the 1.3474 price mark.
Do you want to take your trading to the next level? Join the best platform for that here.


Leave a Reply