Most are aware that some market-influencing fundamentals will emerge at the Federal Reserve’s meeting today. The USDCAD price action seems to be positioning itself to ride any favorable outcomes of this important meeting, going by technical indications. Let’s dive in for more insight.
Major Price Levels:
Resistance Levels: 1.3214, 1.3265, and 1.3320
Support Levels: 1.3200, 1.3150, and 1.3100

USDCAD Bears Are Being Restrained
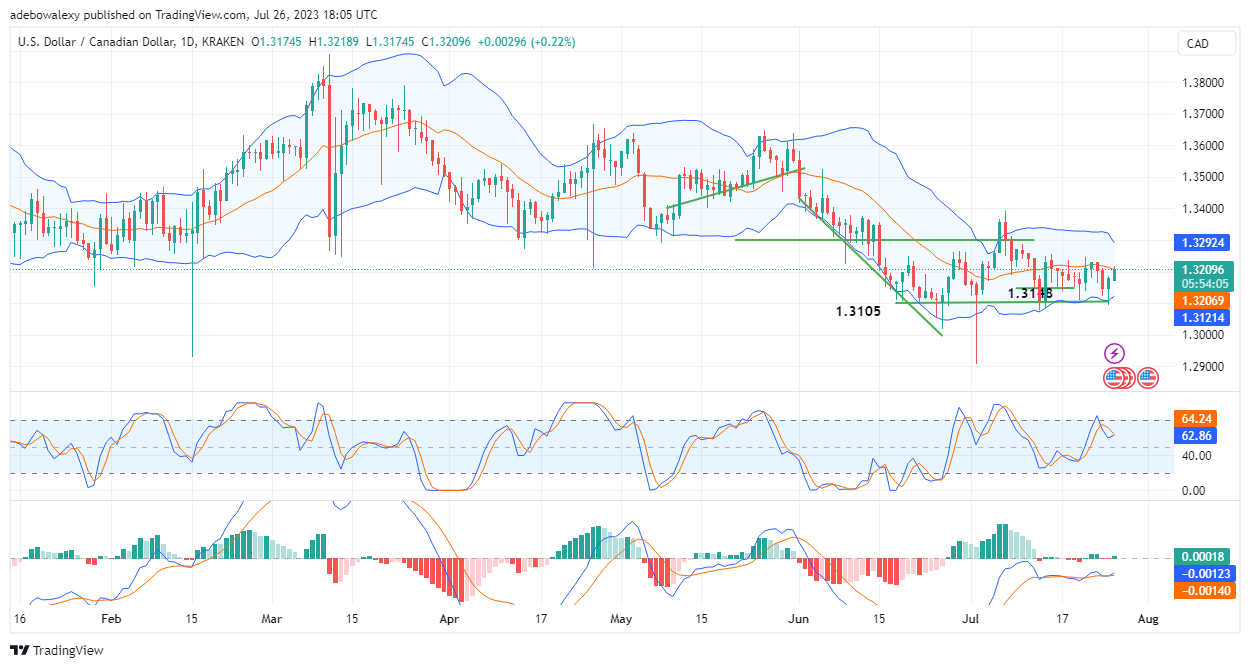
Price action in the USDCAD daily market has retained its position above the middle limit of the Bollinger Bands indicator. Although the market seems to lack much movement today, perhaps due to the anticipation of the Federal Reserve meeting that’s happening today, Nevertheless, price action is maintaining the opinion that upside momentum may still propel prices in an upward direction.
The Relative Strength Index (RSI) indicator lines can be seen inching closer to each other for an upside crossover. Likewise, the Moving Average Convergence Divergence (MACD) indicator curves seem to be gradually picking up an upside bearing from below the equilibrium level. This consequently affirms the possibility of more upside gains to come.

USDCAD Retains Sight on the 1.3350 Short-term Resistance
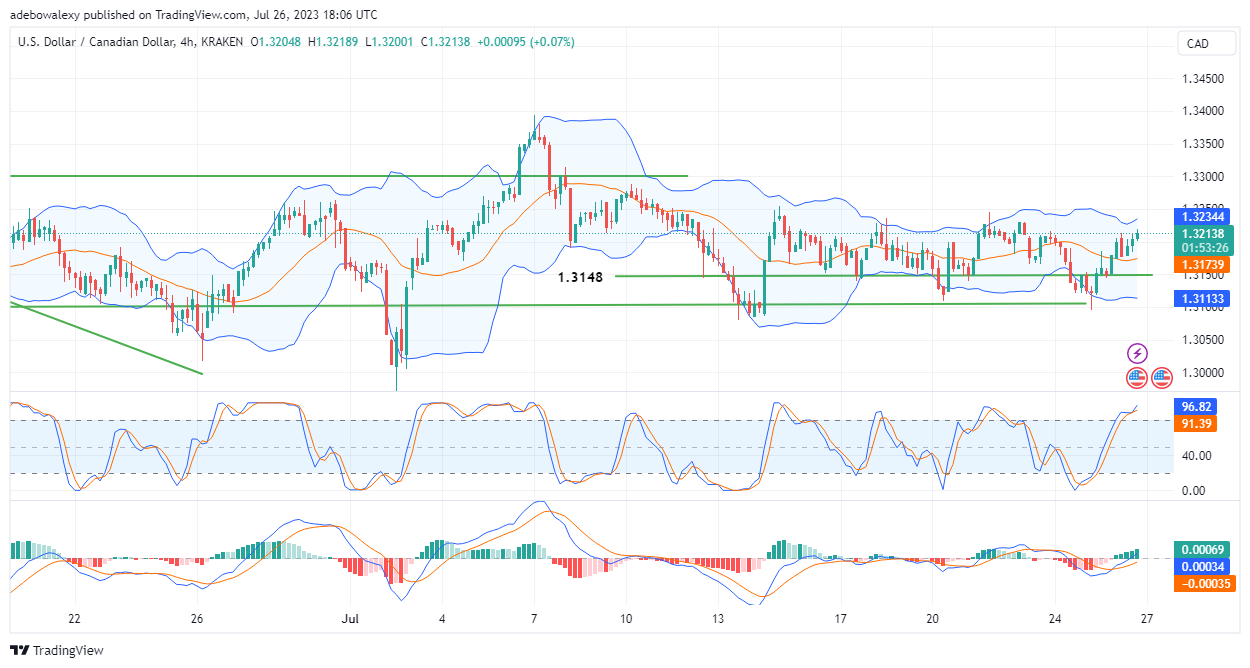
In the USDCAD 4-hour market, one can see that price action has been advancing toward the resistance price mark at an almost constant pace since three trading sessions ago. This can be seen ever since price action recoiled off the middle limit of the Bollinger Bands. Also, the Relative Strength Index (RSI) indicator lines maintain an upside trajectory.
At the same time, the MACD leading line has just crossed above the equilibrium level, with its histogram level growing tall and green. Technically, all indications arising from this market are revealing that price action may be heading toward the 1.3300 mark.
Do you want to take your trading to the next level? Join the best platform for that here.


Leave a Reply