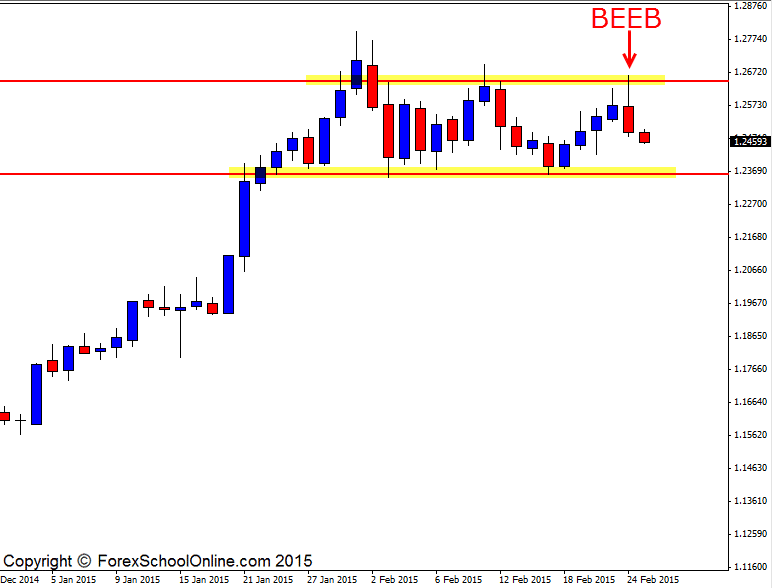
The USDCAD has fired off a Bearish Engulfing Bar (BEEB) on the daily price action chart that is rejecting a key daily resistance level. This resistance is a level that price had tested only two weeks ago on the daily chart. After testing this level price fell back lower and into the major daily support that has been holding price higher.
Price in recent times has been trading in a sideways consolidated pattern with price trading in-between the highs and lows of the tight range that has formed. Price previously was in a strong trend higher with price roaring with strong momentum before pausing when moving into this sideways pattern.
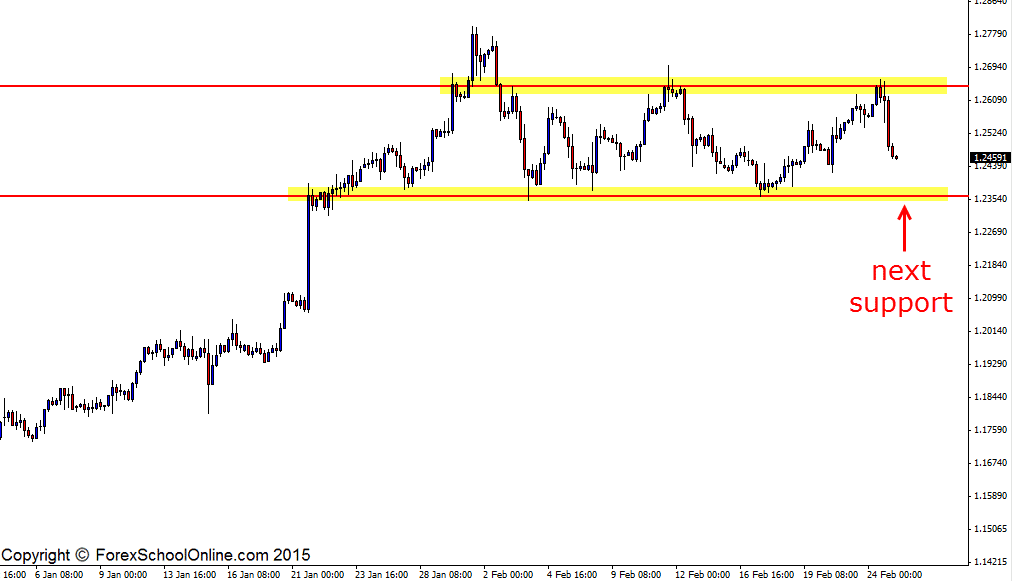
If price can break the low of the bearish engulfing bar and gain momentum, then the near term support is the range low of around 1.2360. This could be a crucial area if price makes it down to this support area because as I just said above; price had been in a strong trend higher and if price makes it into this support lower once more, it could activate a lot more bulls to once again hop aboard the trend higher.
For this trend to really once again activate though, the range highs that have formed would now need to be taken out. If this can happen and the highs as shown on the daily and 4 hour chart below can be taken out and price moves and closes out higher, price could then look to continue the price action trend higher and once again make fresh highs.
Daily USDCAD Chart

4 Hour USDCAD Chart


Leave a Reply