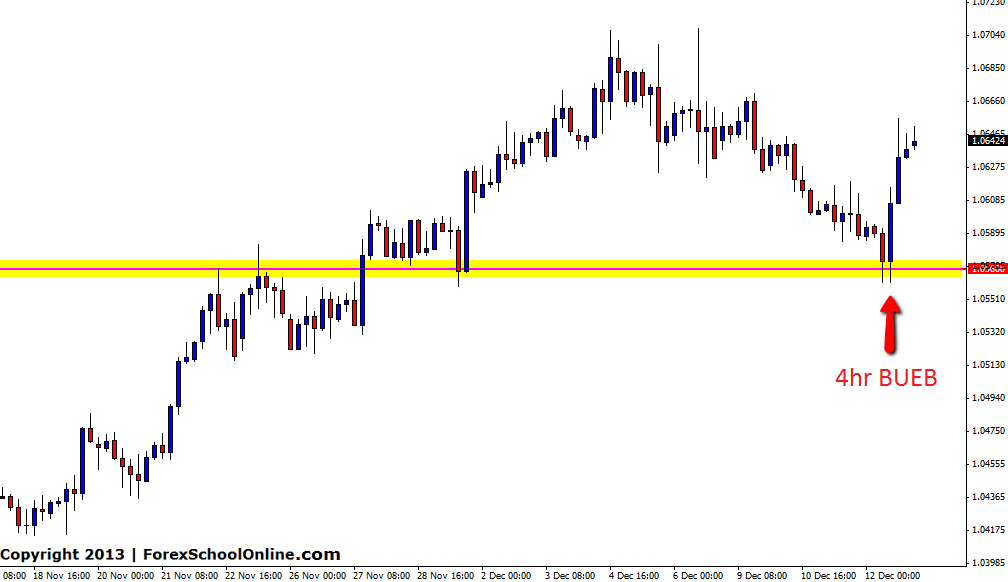
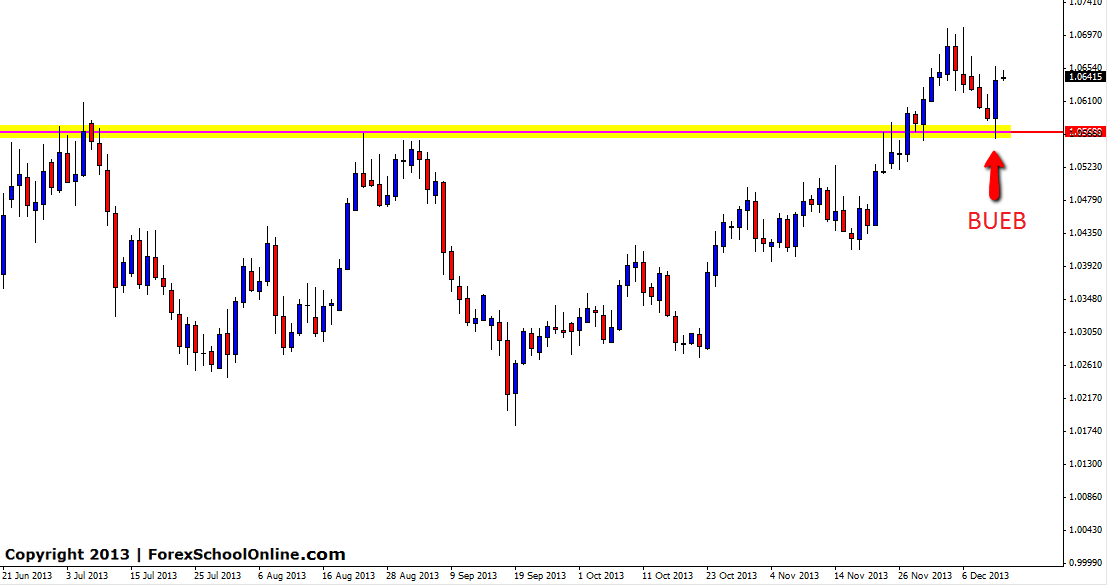
The USDCAD has fired off multi time frame Bullish Engulfing Bars (BUEB) on the 4hr & Daily price action charts. In yesterdays post in this blog I posted about how price had formed a bearish engulfing bar which was pushing price lower and into a key support level that traders could target to start hunting long trades should price print any high probability price action signals. To read yesterdays post see here: USDCAD Bearish Engulfing Bar sends Price Into Key Support.
Once price pushed into this area it produced a large and obvious Bullish Engulfing Bar (BUEB) on the 4hr chart. This BUEB was a solid BUEB because it was large, obvious and it stuck out like a sore thumb. Traders will notice that it was not hiding or stuck in a bunch of price, but rather down at the low which is key. The most important thing about this setup was that because it was being traded as a reversal setup it was down at a swing low. A MASSIVE mistake traders make is trading reversals from the incorrect swing points and this was at the correct swing low. You can read about how to trade from the correct swing points here: How to Trade Forex Price Action From the Correct Swing Points
After price formed the 4hr BUEB is has since gone on to move higher which has seen the daily chart also form a BUEB. Whilst the daily chart is also a valid setup, the 4hr chart was a lot cleaner and higher probability because it had a lot more space to move into where as the daily has a bit of traffic to push into if it wants to move higher. The pullback on the daily chart is not as deep as what the 4hr chart is and this is what created more space for the 4hr chart. I explain how this works and how intraday charts can have a lot more space to trade into whilst still trading from key daily marked levels in the following video: The Secrets Traders Can Learn From Price Action
USDCAD 4hr Chart

USDCAD Daily chart


Leave a Reply