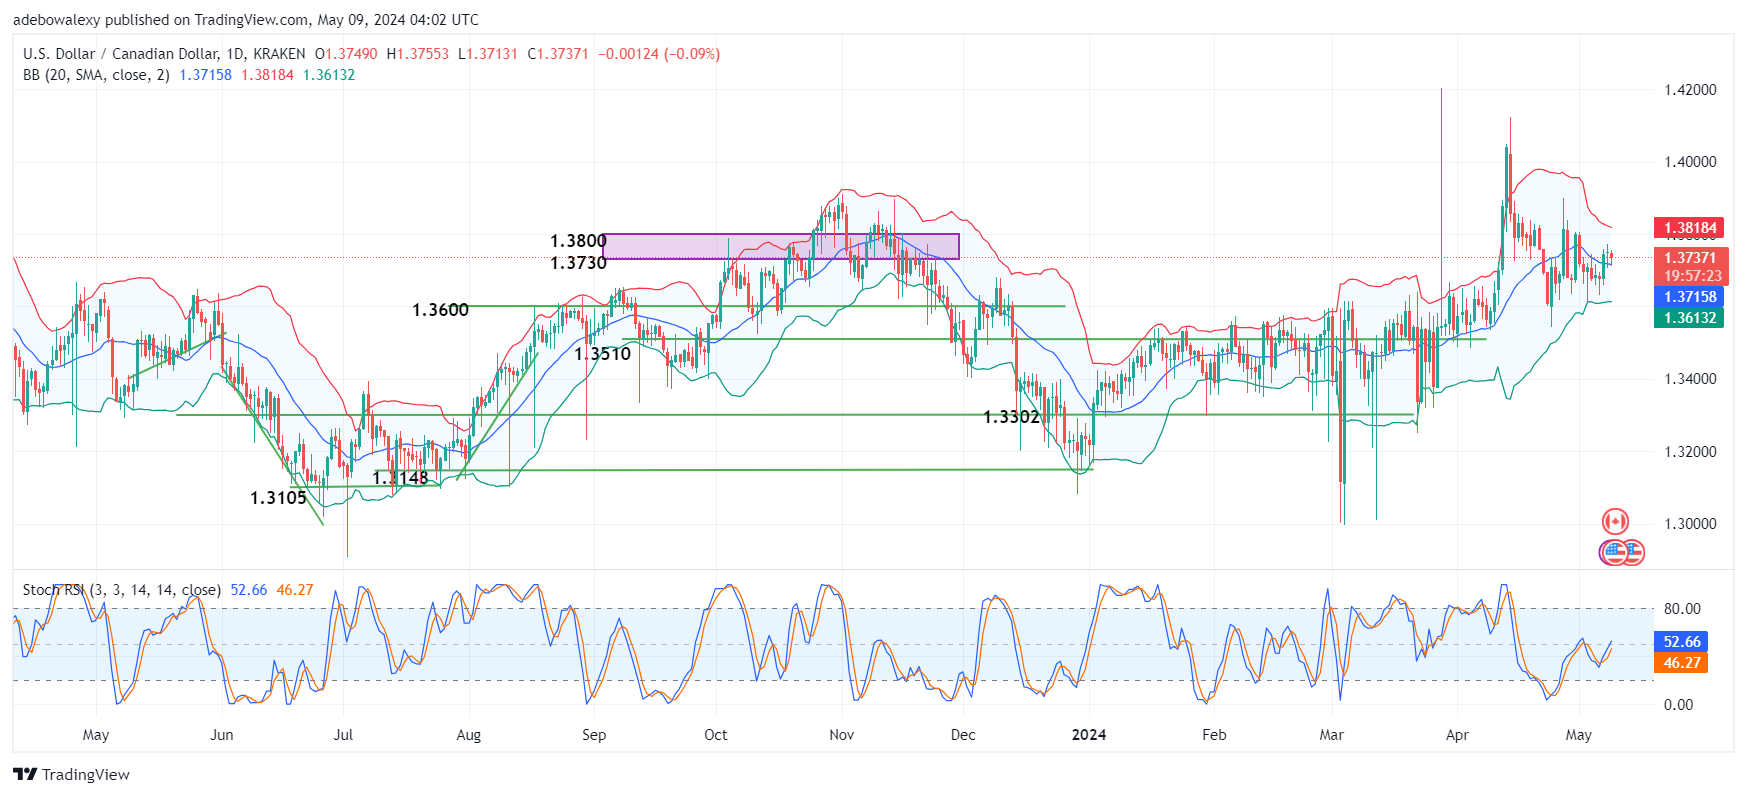
USDCAD displayed a bright spark on Tuesday. However, that spark became gloomy as the upside momentum cooled significantly yesterday (Wednesday). However, the pair seems to still maintain some positive stance based on indications coming from technical indicators.
Key Price Levels:
Resistance Levels: 1.3800, 1.3900, and 1.4000
Support Levels: 1.3700, 1.3600, and 1.3500

USDCAD Prints Some Losses
The USDCAD daily market has revealed that headwinds are taking effect. This seems to have started yesterday when the upside momentum dimmed significantly. Subsequently, the market’s downward forces seem to have gained strength with the appearance of a red price candle for today’s trading session.
However, the pair still trades above the middle limit of the Bollinger Bands. Likewise, the Stochastic Relative Strength Index (SRSI) indicator lines can be seen maintaining an upward trajectory. At this point, it appears that the market is still trying to hold on to its upside path.

USDCAD Is Trying To Resist Further Losses
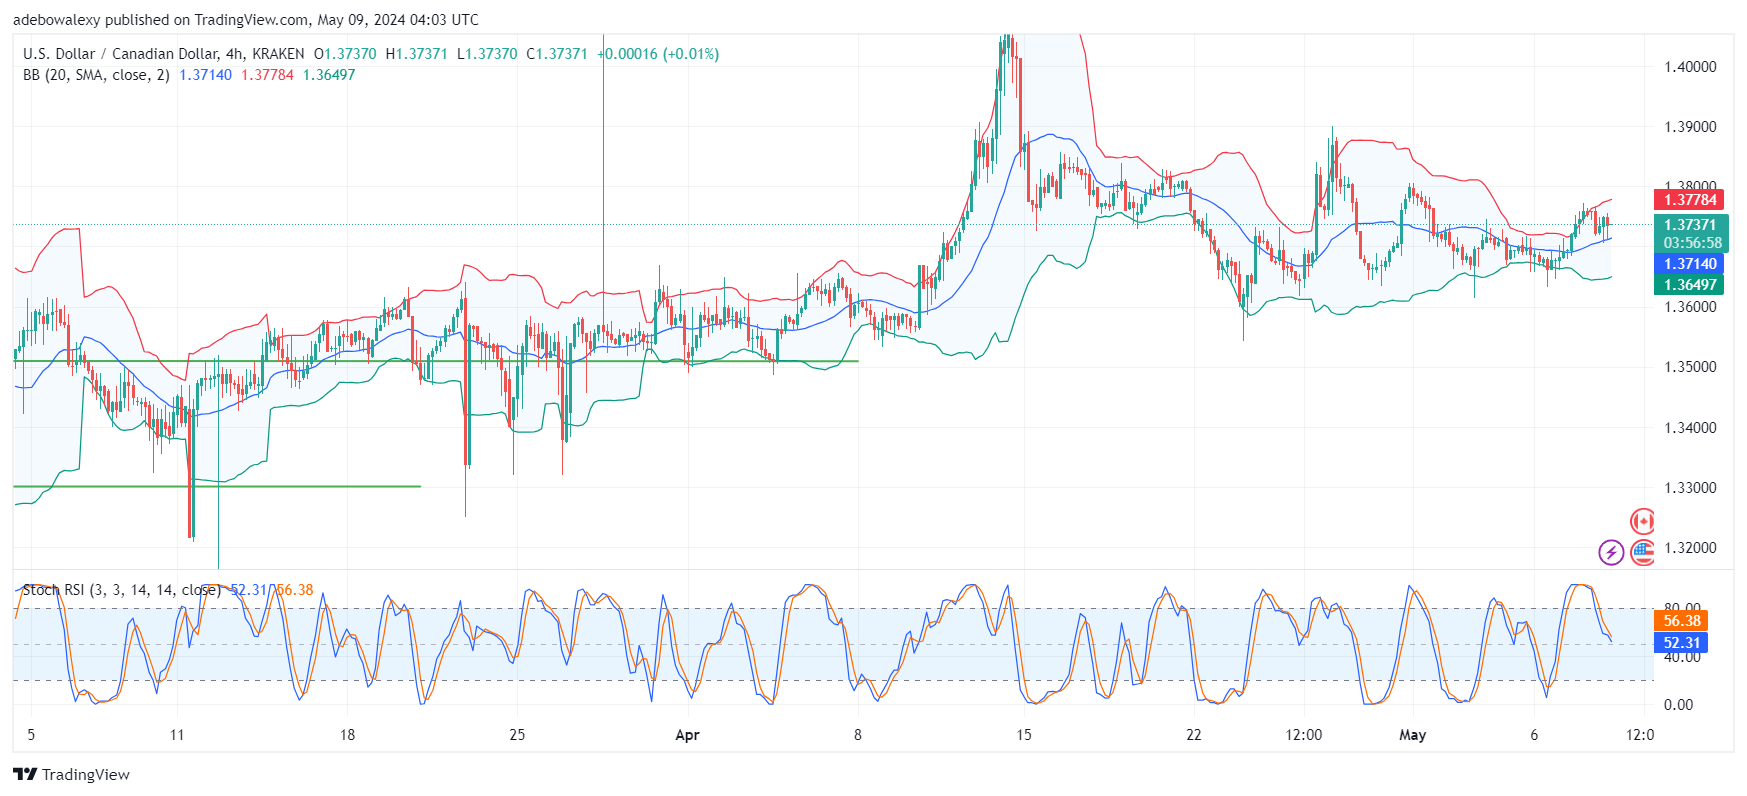
Moving further to a USDCAD market of 4 hours, one can see that a green dash-shaped price candle has appeared for the ongoing session. Also, it has appeared above the middle limit of the Bollinger Bands. This seems to signal that upside forces may be regaining strength gradually.
But on the contrary, it could be seen that the SRSI indicator lines are sticking to a downward path. This kind of introduces some intrigue to this market. As it stands, traders may choose to consider the fact that the market is showing signs of bullish recovery above the middle band of the Bollinger Bands indicator. This will keep Forex signals with targets at the 1.3800 market useful.
Do you want to take your trading to the next level? Join the best platform for that here.


Leave a Reply