The USDCAD market has further advanced on its bearish path today. This occurred following yesterday’s sudden and sharp price dip. However, today’s price decline seems dwarfed by that of yesterday at this point. So, let’s take a closer look at things in this market.
Key Price Levels:
Resistance Levels: 1.3600, 1.3700, and 1.3800
Support Levels: 1.3507, 1.3500, and 1.3400

USDCAD Continues to Head South
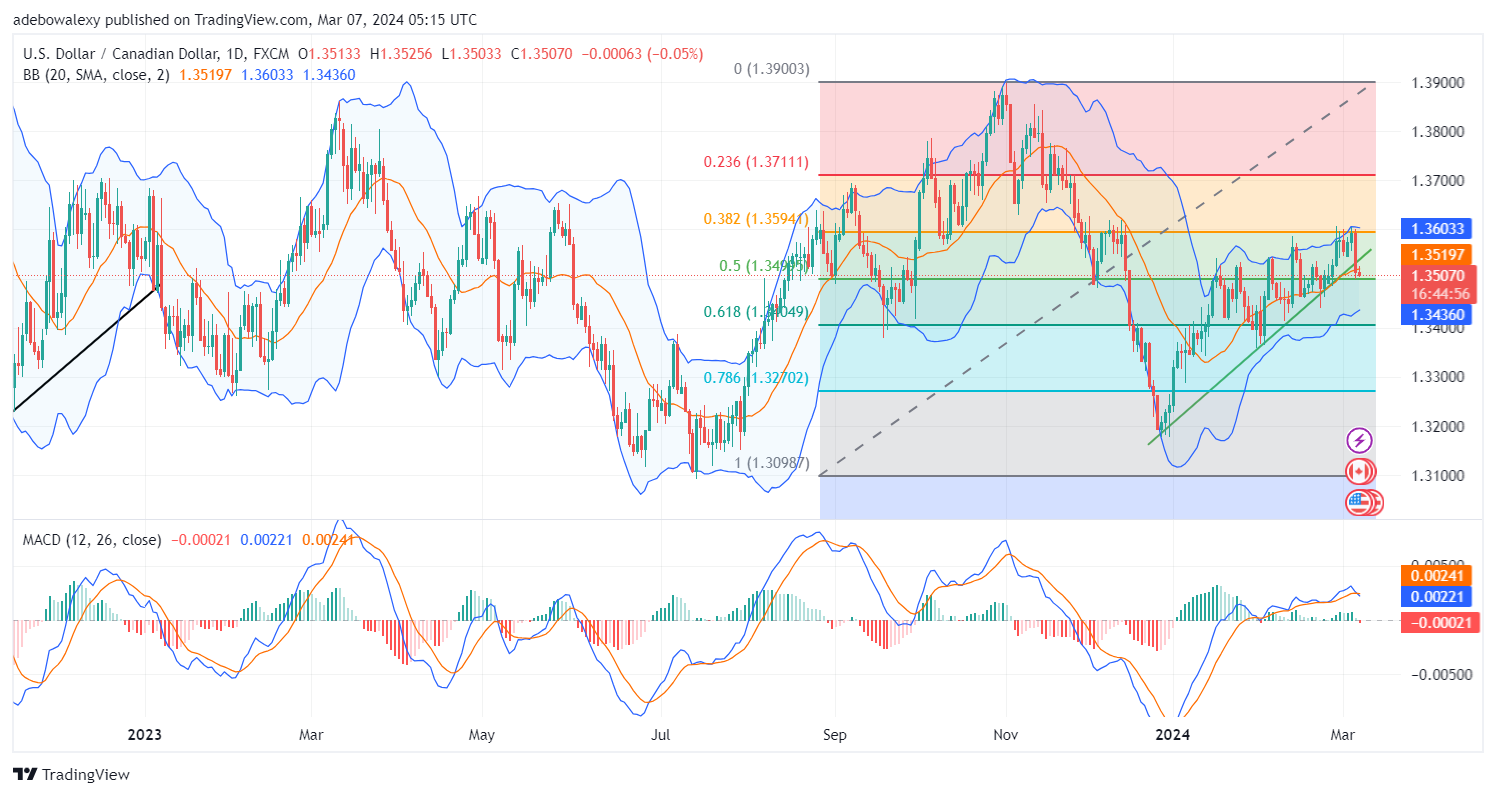
Moderate dollar weakness has been able to restrict the USDCAD pair to a bearish path. The current session is headed towards the support level formed by the 50 Fibonacci Retracement level. The mentioned support lies below the middle limit of the Bollinger Bands and therefore suggests that this market is in a downtrend.
Likewise, the Moving Average Convergence Divergence (MACD) indicator has just performed a bearish crossover above the centerline. Bolstering bearish hopes in this market is the bar of the MACD indicator that has appeared solid red below the equilibrium level, indicating a possible persistent downward correction at this point.

Headwinds Retain the Lead in the USDCAD Market
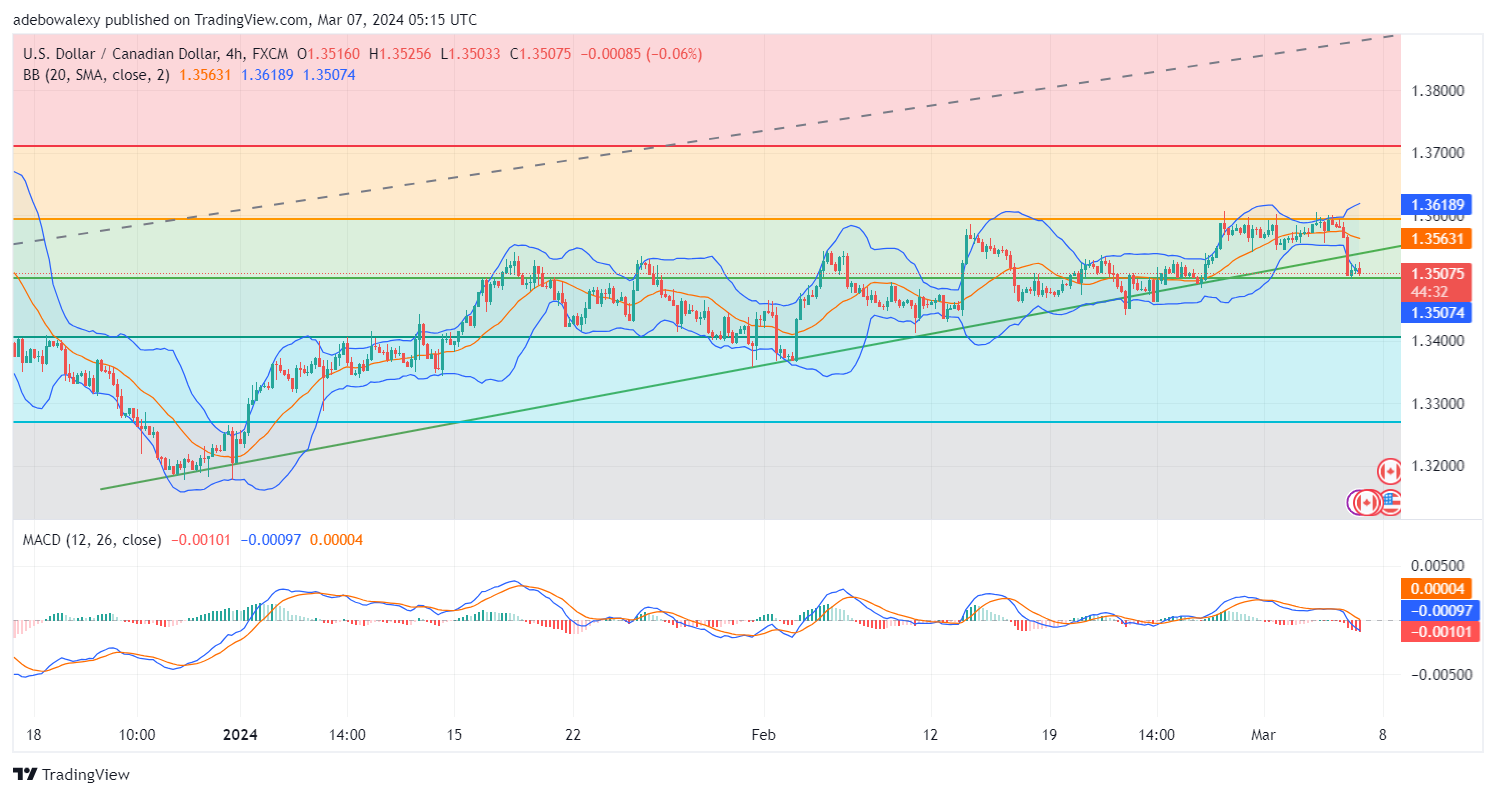
The USDCAD 4-hour market is showing that downward forces are quite strong. This could be seen as the tiny resistance that was staged above the Fibonacci Retracement level being quickly overpowered in the ongoing session.
Also, with trading activities occurring below the middle limit of the Bollinger Bands, headwinds are threatening to break the 1.3500 psychological level. In addition, the MACD indicator lines have kept falling below the equilibrium level. The bars of the MACD are also solid red in appearance, which points out that prices will likely fall closer to the 1.3450 mark, making bearish Forex signals quite the deal at this point.
Do you want to take your trading to the next level? Join the best platform for that here.


Leave a Reply