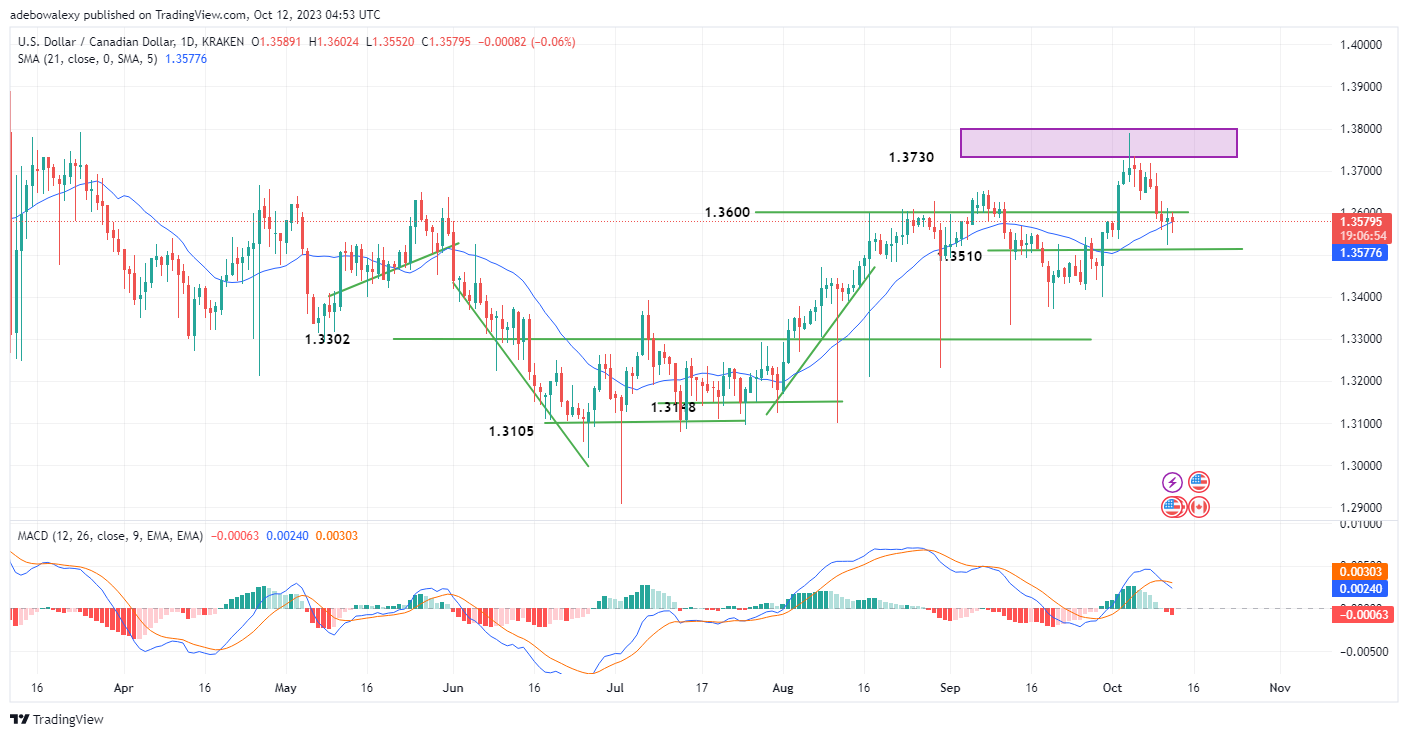
After USDCAD’s price action turned south near the 1.3700 resistance, it broke down the support at the 1.3600 mark in the past two sessions. Price action in this market paused above a psychological support at 1.3578. However, the ongoing session shows that the pair may yet reach lower levels.
Major Price Levels:
Resistance Levels: 1.3600, 1.3650, and 1.3700
Support Levels: 1.3578, 1.3550, and 1.3510

USDCAD Bulls Keep Losing Traction as USD Continues to Lose Momentum
After a brief pause above the 1.3578 price level, the USDCAD market seems to have resumed its bearish trend. The last price candle on this chart now rests on the 21-day Moving Average (MA) curve as a support level. Meanwhile, the Moving Average Convergence Divergence (MACD) indicator has turned south above the equilibrium point.
A bearish crossover has occurred on the MACD indicator, while its bars indicate that bearish momentum is increasing. Consequently, the building momentum in the ongoing session will likely continue to push prices down in this market.
USDCAD Retains a Bearish Outlook
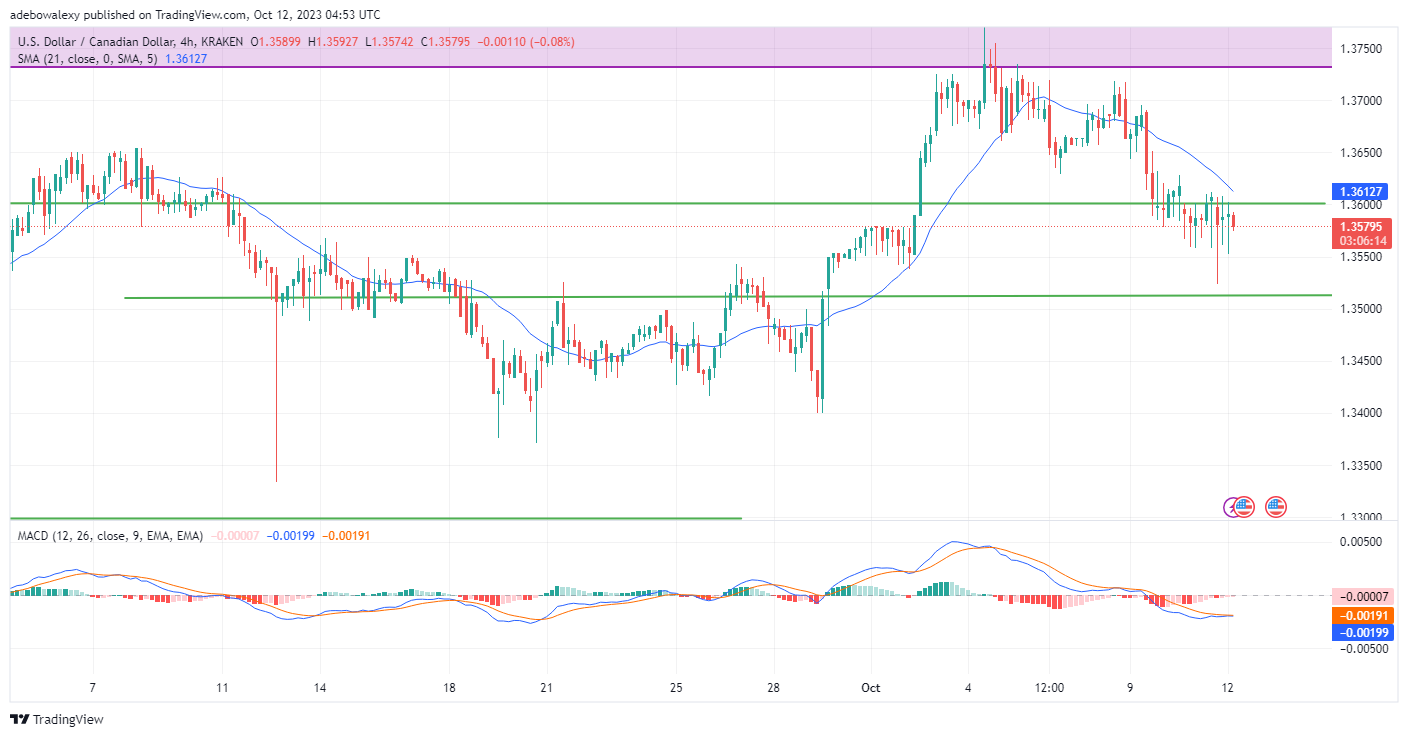
In line with the perceived bearish trend in the USDCAD daily market, the 4-hour market appears to confirm the same bearish sentiment. Considering the latest price candle on this chart, it can be observed that the ongoing session has a stronger bearish tone. Meanwhile, trading continues below the 21-day MA line.
Additionally, the MACD lines are still below the equilibrium level. Although they are approaching a crossover, other contributing indicators do not align with the possibility of a bullish crossover. Therefore, it seems that prices in this market may trend towards the 1.3500 mark.
Do you want to take your trading to the next level? Join the best platform for that here.


Leave a Reply