The constant fundamentals surrounding the USD seem to have kept the USDCAD pair on a bearish trajectory. Price action in this market has extended a retracement towards lower support levels. Let’s examine this market to see how things play out.
Major Price Levels:
Resistance Levels: 1.3300, 1.3400, and 1.3500
Support Levels: 1.3268, 1.3200, and 1.3150

USDCAD Heads Toward the 1.3200 Support
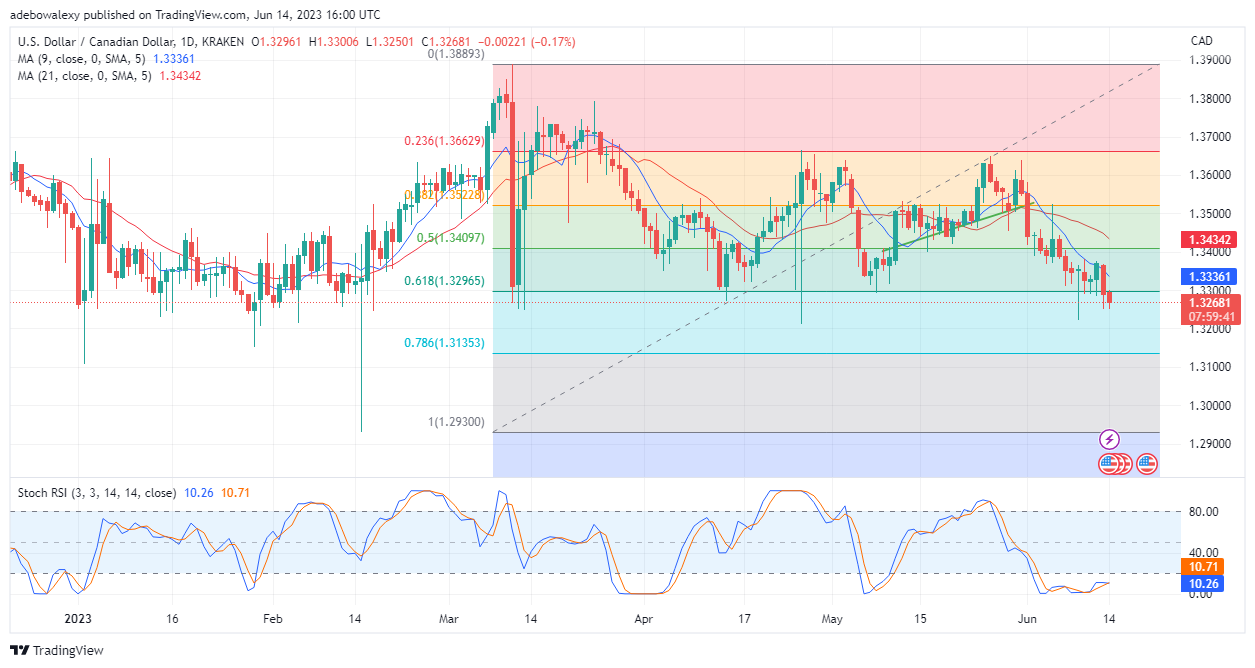
In light of the continued constancy of monetary policy surrounding the dollar, the USDCAD pair has extended its downward retracement towards lower support levels. The last price candle on the daily chart is a moderate-sized bearish price candle. This price candle has a price closer to support at the 1.3200 price mark. Meanwhile, the anticipated crossover has been delivered on the Relative Strength Index (RSI) indicator, which strengthens the hopes of bear traders. It is worth noting that price activity is occurring below the 9- and 21-day Moving Average curves. Consequently, indications here support the hopes of short traders.

USDCAD Stays on Course Toward the 1.3200 Price Mark
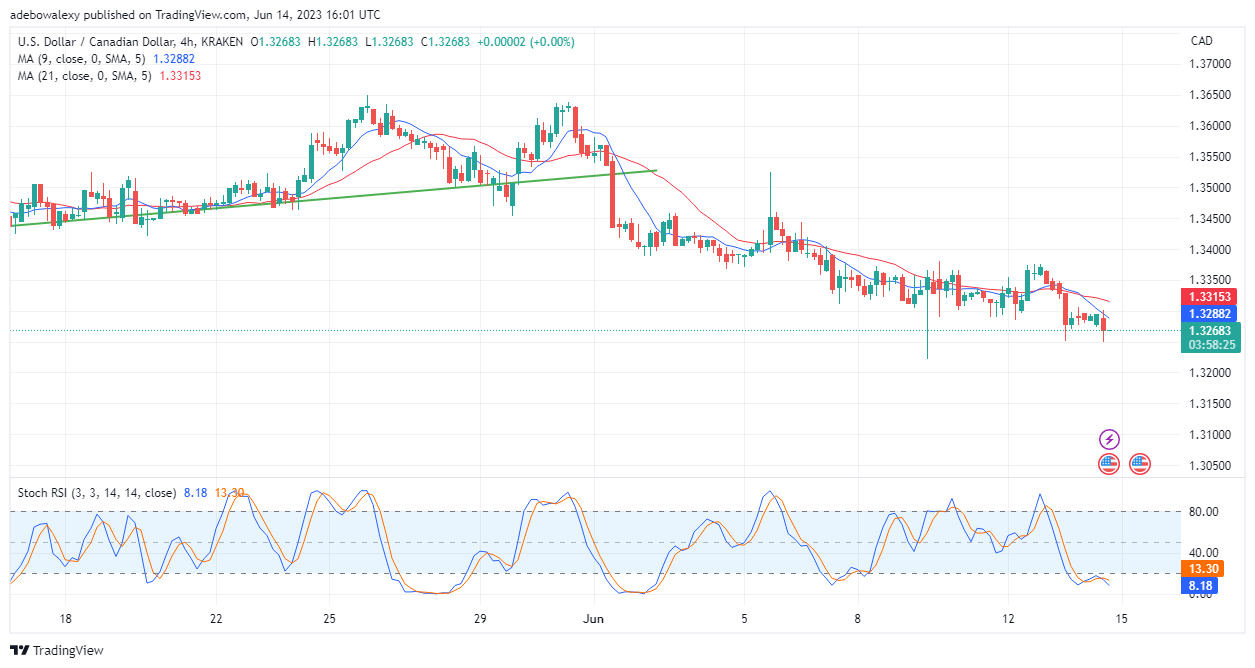
In the 4-hour USDCAD market, price action remains largely headed toward the aforementioned support level. This is happening despite the green and dashed-shaped price candle that has just appeared on this chart. Also, the RSI lines keep trending lower into the oversold region following a crossover. This suggests that the staged resistance to downward retracement may be too weak to hold. Moreover, the earlier mentioned unchanged policy surrounding the dollar seems to have set this path in stone. Therefore, traders can anticipate further retracement towards the 1.3200 mark.
Do you want to take your trading to the next level? Join the best platform for that here.


Leave a Reply