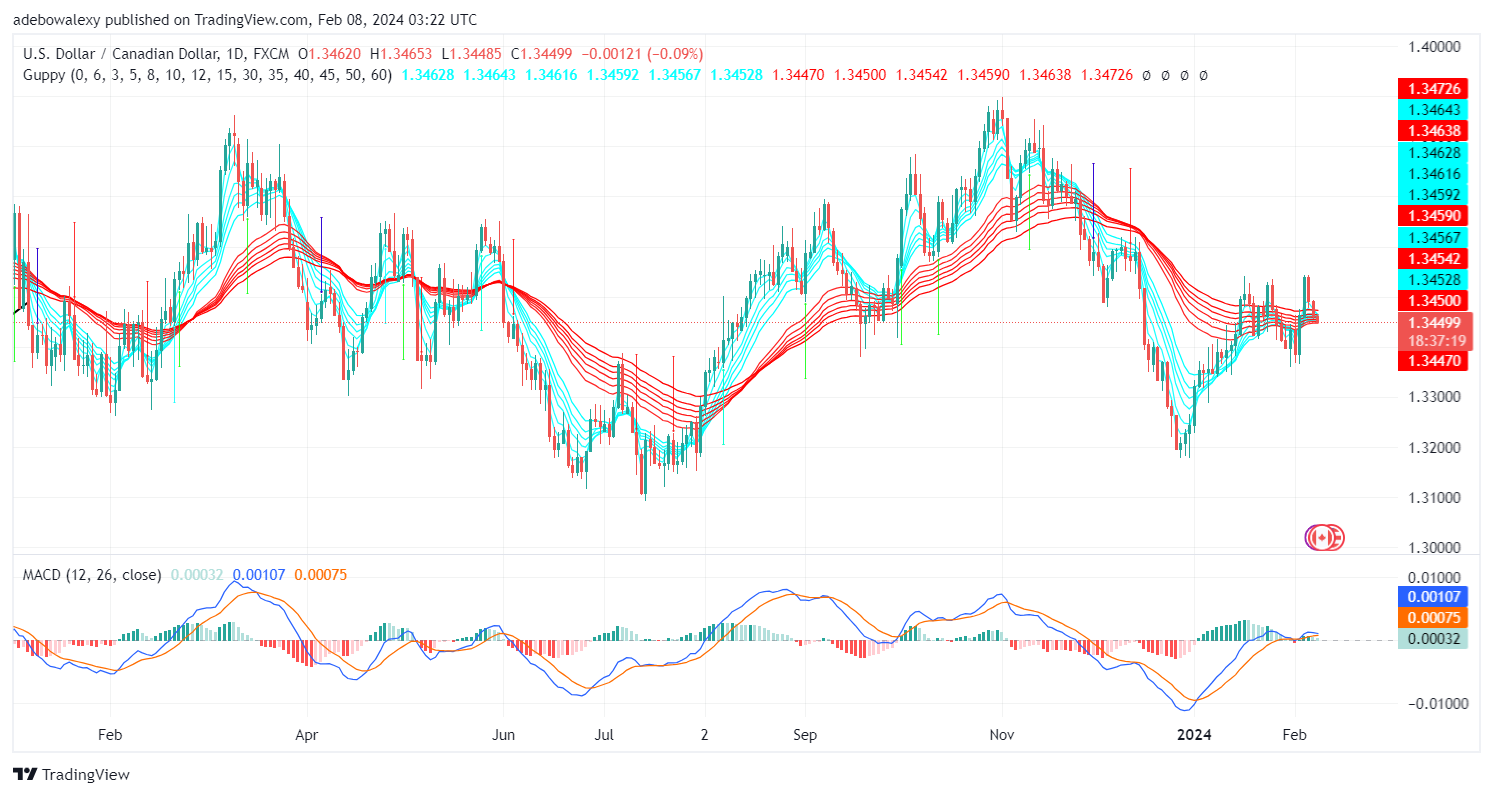
USDCAD has continued to weaken against its counterpart. This seems largely due to the Federal Reserve’s decision to leave rates unchanged. Coupled with burgeoning economic developments on the CAD side, headwinds continue to drive the market toward lower price levels.
Key Price Levels:
Resistance Levels: 1.3500, 1.3600, and 1.3700
Support Levels: 1.3450, 1.3400, and 1.3300

USDCAD Continues to Fall Through Key Marks
In the USDCAD daily market, price action has kept falling through the support formed by the Guppy Multiple Moving Average curve (GMMA) line. This started about two sessions ago, and the subsequent sessions have continued the trend. The current session has placed the pair’s price just below the crossed GMMA curves.
Technically, this signals that this market may take on a more bearish characteristic. In addition, the Moving Average Convergence Divergence (MACD) indicator lines are converging very near the equilibrium level.
Also, the bars of this indicator show that downward forces are gaining ground, with the appearance of the indicator bar being pale red above the equilibrium level. Consequently, this suggests that, as it stands, this market may head more southwards.

USDCAD Looks Ready to Extend Downward Corrections
On the USDCAD 4-hour market, we can see that the last price candle has appeared further below the crossed set of GMMA lines. Likewise, the color of this price candle is red, indicating additional losses for the pair.
The MACD leading line has started testing the equilibrium level from above it, while the bars of the indicator appear solid red below the equilibrium level. By implication, this suggests that downward momentum is formidable enough to cause further price declines in this market. As a result, bearish trades can stick to Forex signals targeting the 1.3420 or even 1.3400 price marks.
Do you want to take your trading to the next level? Join the best platform for that here.


Leave a Reply