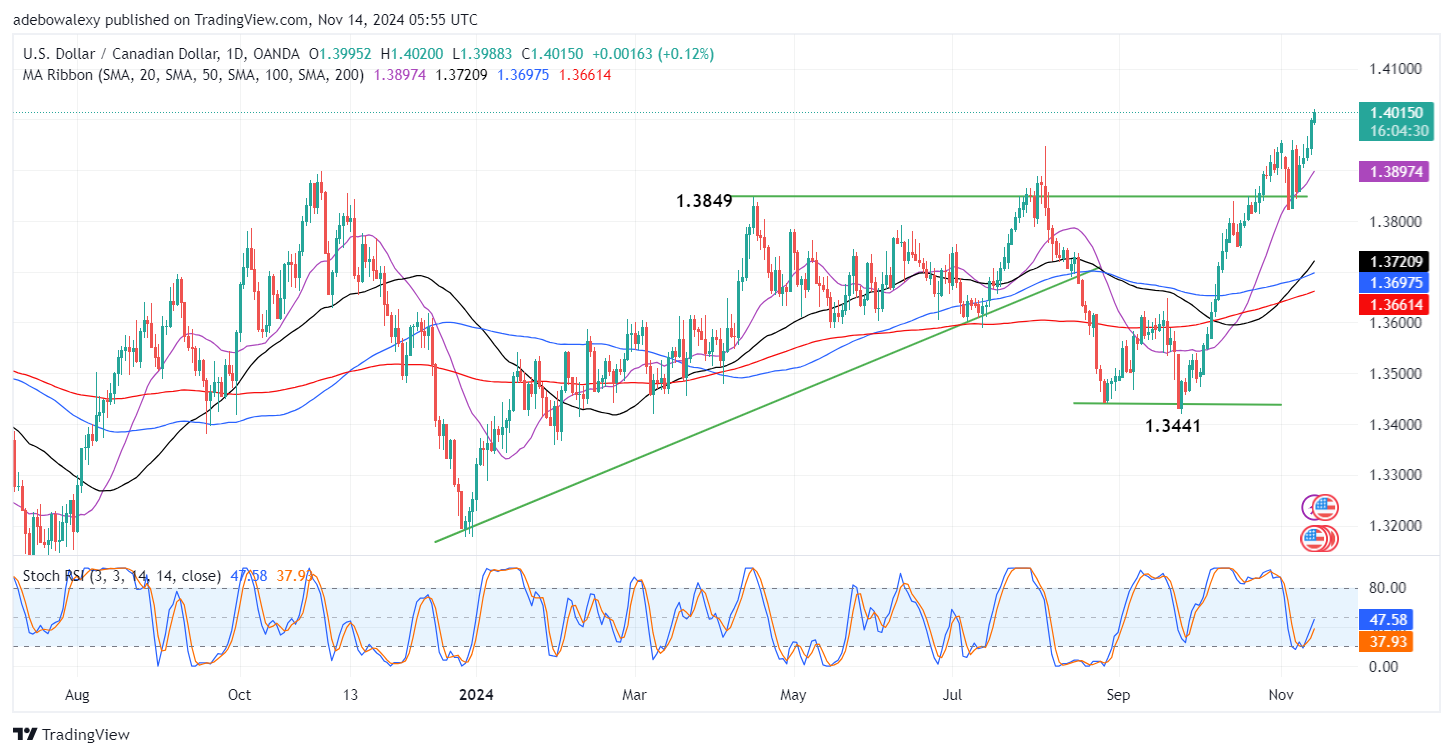
The US dollar has maintained its strong stance since the arrival of key economic data such as the CPI and GDP growth. This has fueled an upward correction in the greenback. Consequently, this caused the USDCAD to continue its upward correction through the 1.4000 resistance level.
Key Price Levels:
Resistance Levels: 1.4100, 1.4300, 1.4500
Support Levels: 1.4000, 1.3800, 1.3600

USDCAD Bulls Are Standing Strong
Today’s trading session in the USDCAD daily market started on the same path as the previous one. The last price candle on the chart can be seen appearing green, pushing the market further upwards through the 1.4000 price level. Also, this keeps the pair trading above all the Moving Average (MA) lines on the chart.
The MA lines continue to cross each other below price action at a significant distance. At the same time, we can see that the Stochastic Relative Strength Index (RSI) lines are rising steadily upward from the oversold region following a bullish crossover. Technically, this aligns with price activity on the chart to hint that upside forces may have the right ground to cause further upward corrections.

USDCAD Market Obtains Support Above 1.4000
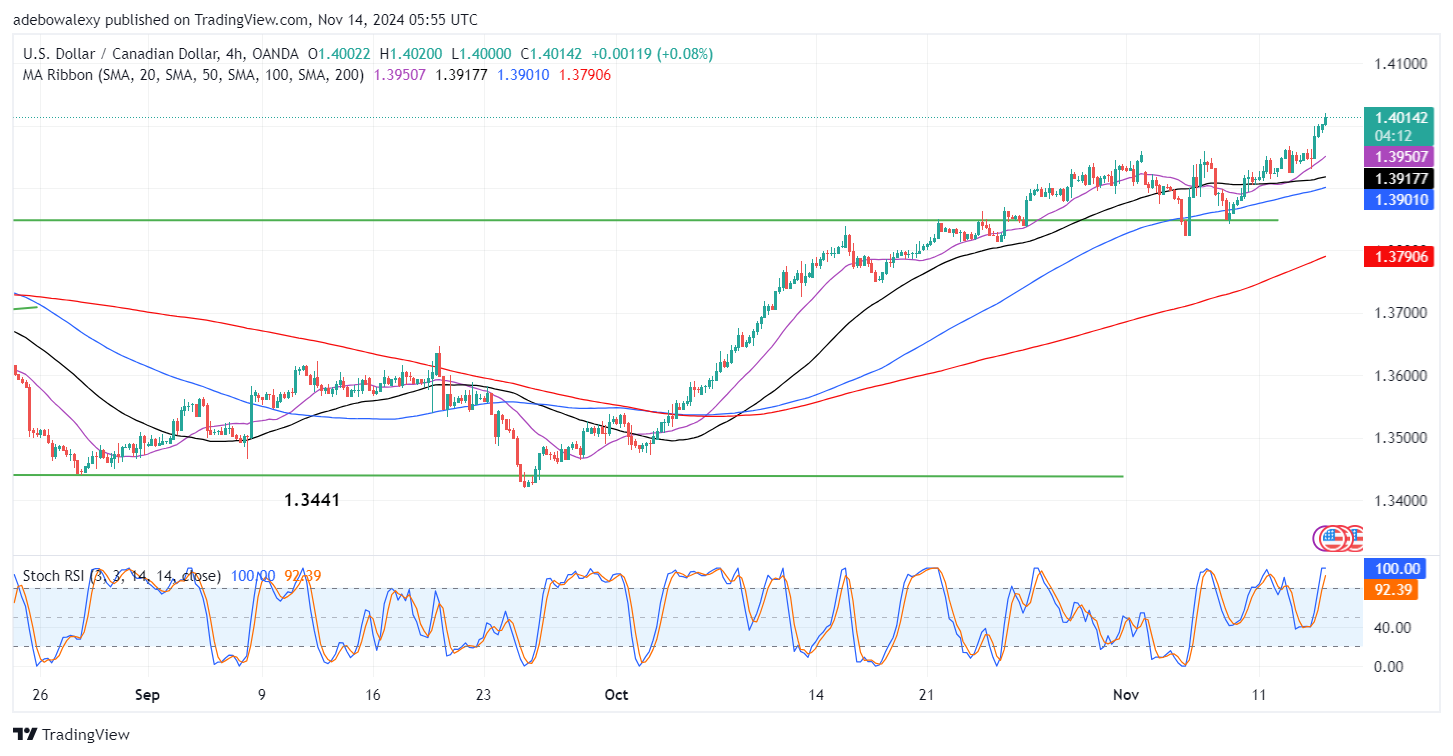
The USDCAD 4-hour chart seems to point to an even more interesting event in this pair. While the daily chart has it that price action in the market has just broken a new technical resistance, the 4-hour chart has it that price action may have obtained support above the 1.4000 price level. The last price candle here can be seen standing above the 1.4000 price level as technical support.
Also, trading activity continues above all the MA lines. Also, the Stochastic RSI lines have reached the overbought region with the leading line preparing to drag there given the persistent nature of the upside forces. This may give the price the chance to rise further toward the 1.4050 mark, but traders should monitor relevant fundamentals for impetus.
Do you want to take your trading to the next level? Join the best platform for that here.


Leave a Reply