The US dollar has witnessed some significant momentum emanating from the fundamentals that have arrived this week. Nevertheless, it could be seen that profits gathered in today’s session have been reduced.
Major Price Levels:
Resistance Levels: 1.3724, 1.3800, and 1.3850
Support Levels: 1.3700, 1.3650, and 1.3600

USDCAD Bulls Face Suppression
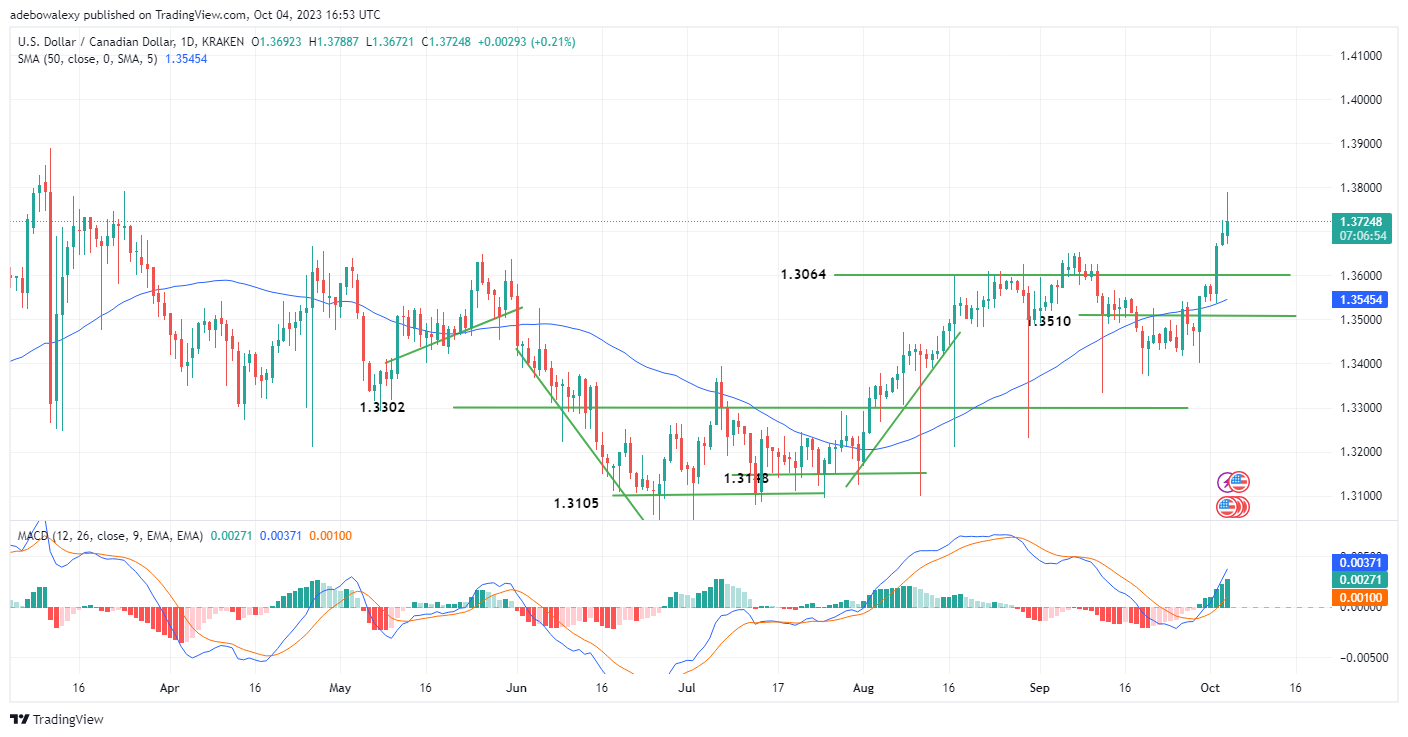
As soon as price action surpassed the 1.3700 mark, USDCAD price action faced rejection. This restricts upside progress in this market. Nevertheless, price action stays above the 50-day Moving Average (MA) indicator line.
Also, it could be seen that the Moving Average Convergence Divergence (MACD) indicator lines continue ramping upwards above the equilibrium level. Additionally, the bars of this indicator are solid green and are increasing in length, which is a pointer to increasing upside momentum. This is so despite the moderate downward correction in the ongoing trading session.

Technical Indicators in the USDCAD Market Appears Divergent
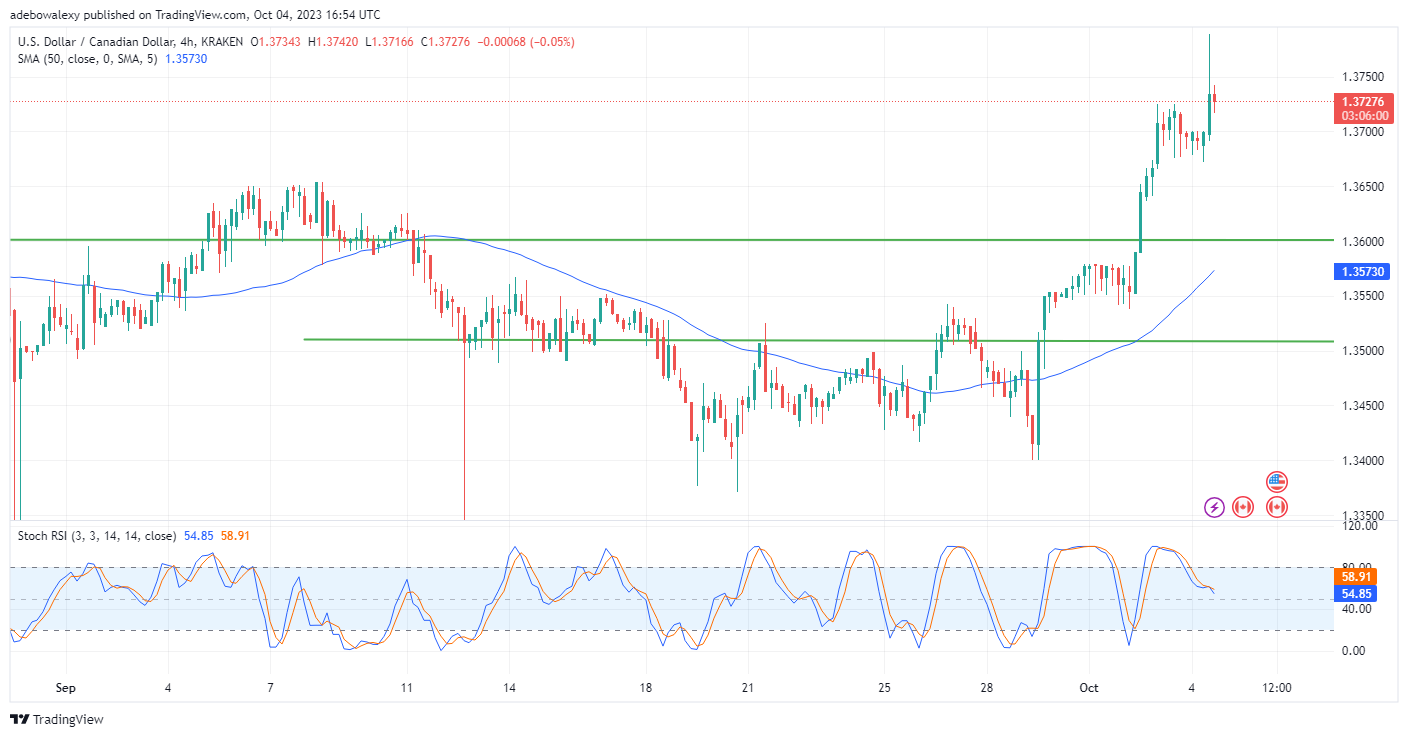
Although the price of the USDCAD pair has increased in the 4-hour market, it could be seen that technical indicators are somewhat divergent. Trading activities in this market continue to occur at significant distances above the 50-day MA line. Meanwhile, the Stochastic Relative Strength Index (RSI) indicator curves seem to have continued to trend downwards after failing to initiate a reversal move. Consequently, this suggests that the downward correction may extend towards lower support at the 1.3700 mark.
However, it seems too early to come to such a conclusion. Traders in this market should stay on their bullish ambition towards the 1.3800 mark, as a downward correction at this point will require the arrival of some bear-favoring fundamentals.
Do you want to take your trading to the next level? Join the best platform for that here.


Leave a Reply