The stronger fundamentals surrounding the US dollar have favored the USDCAD pair. This has continued to propel the price action in this market toward higher price marks. Let’s examine the chances of price activity clinching the 1.3300 mark or possibly breaking it.
Major Price Levels:
Resistance Levels: 1.3261, 1.3300, and 1.3350
Support Levels: 1.3231, 1.3200, and 1.3150

USDCAD Upside Correction Continues
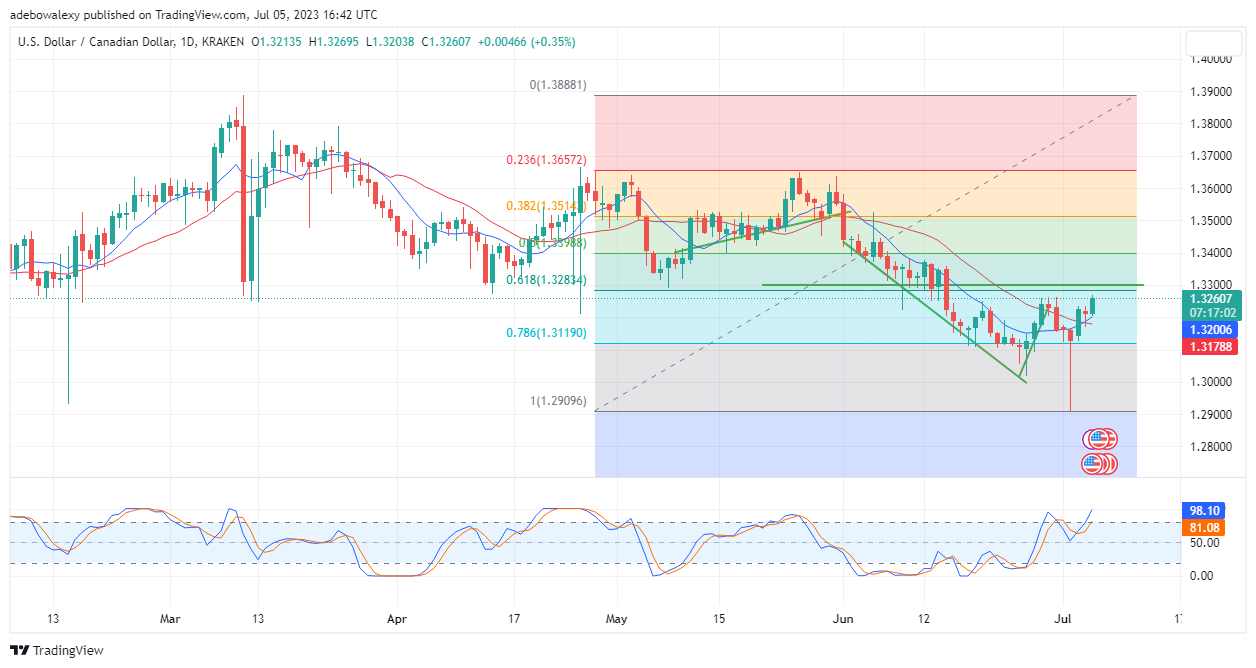
Price activities in the USDCAD market continue to advance towards the 1.3300 mark. Technical indicators used in the analysis of this market continue to maintain a positive stance concerning a continued upside move in this market.
The last price candle on this price chart has further pushed prices higher above the 9-day and 21-day Moving Average (MA) curves. Even, the size of this price candlestick suggests that long traders have significant confidence. The Relative Strength Index (RSI) indicator curves continue to rise higher into the overbought region.
By implication, we can deduce that bullish momentum is still strong enough to support further price increases in this market. Consequently, traders can still expect prices to keep rising.

USDCAD Proceeds Towards the 1.3300 Mark With Caution
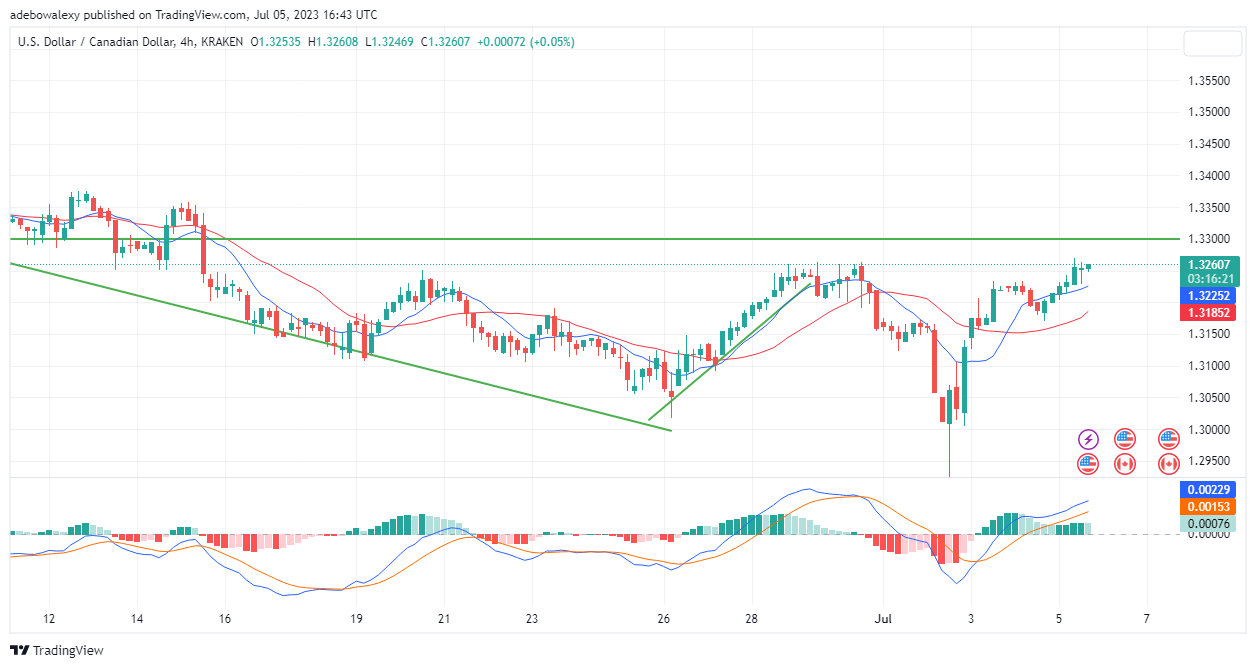
In the 4-hour market, it could be perceived that bulls are still managing to retain control of price movements. While price action remained above the MA lines, another session has begun in favor of the bulls. The last candlestick here has pushed the price further closer to the 1.3300 mark.
Also, the curves of the Moving Average Convergence Divergence (MACD) keep moving upwards above the equilibrium level. Although the last bar here looks pale, considering the distance between the two MACD curves, it suggests that price action may recover from acting downside forces. As a result, prices may retrace the 1.3350 mark.
Do you want to take your trading to the next level? Join the best platform for that here.


Leave a Reply