The new week seems quite eventful, as more key fundamentals are set to roll out. Consequently, this has caused the USD to pause, thereby giving upside forces strength in the GBP/USD market. It appears that all eyes are on the economic developments set to emerge.
Key Price Levels:
Resistance Levels: 1.2266, 1.2400, and 1.2500
Support Levels: 1.2200, 1.2100, and 1.2000

GBP/USD Market Breaks the Resistance at the 1.2259 Price Mark
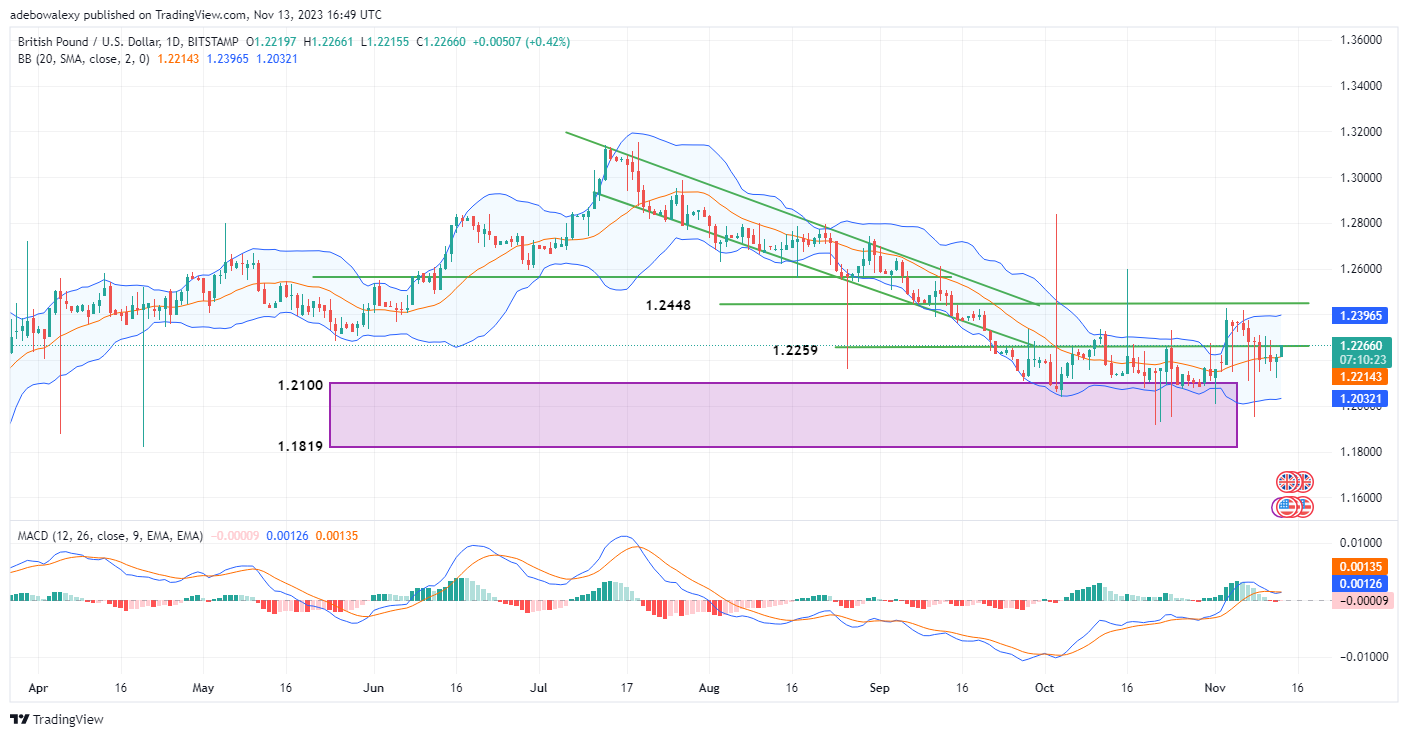
The observed upside correction in the GBP/USD daily market has seen price activity rise through the price ceiling at the 1.2259 mark. The upside correction started in the previous session and has progressed in the new week as the market anticipates key data. Today’s session has witnessed more significant movements than in the previous session, and this has seen the pair push through the mentioned resistance, with more movements likely to come ahead of the key fundamentals.
Pounds versus dollars now trade above the middle limit of the Bollinger Bands indicator. Likewise, a bullish crossover seems to be on the way on the Moving Average Convergence Divergence (MACD) indicator. As a result, this suggests that prices may rise even higher.

GBP/USD Seeks Clear Support Above the 1.2259 Mark
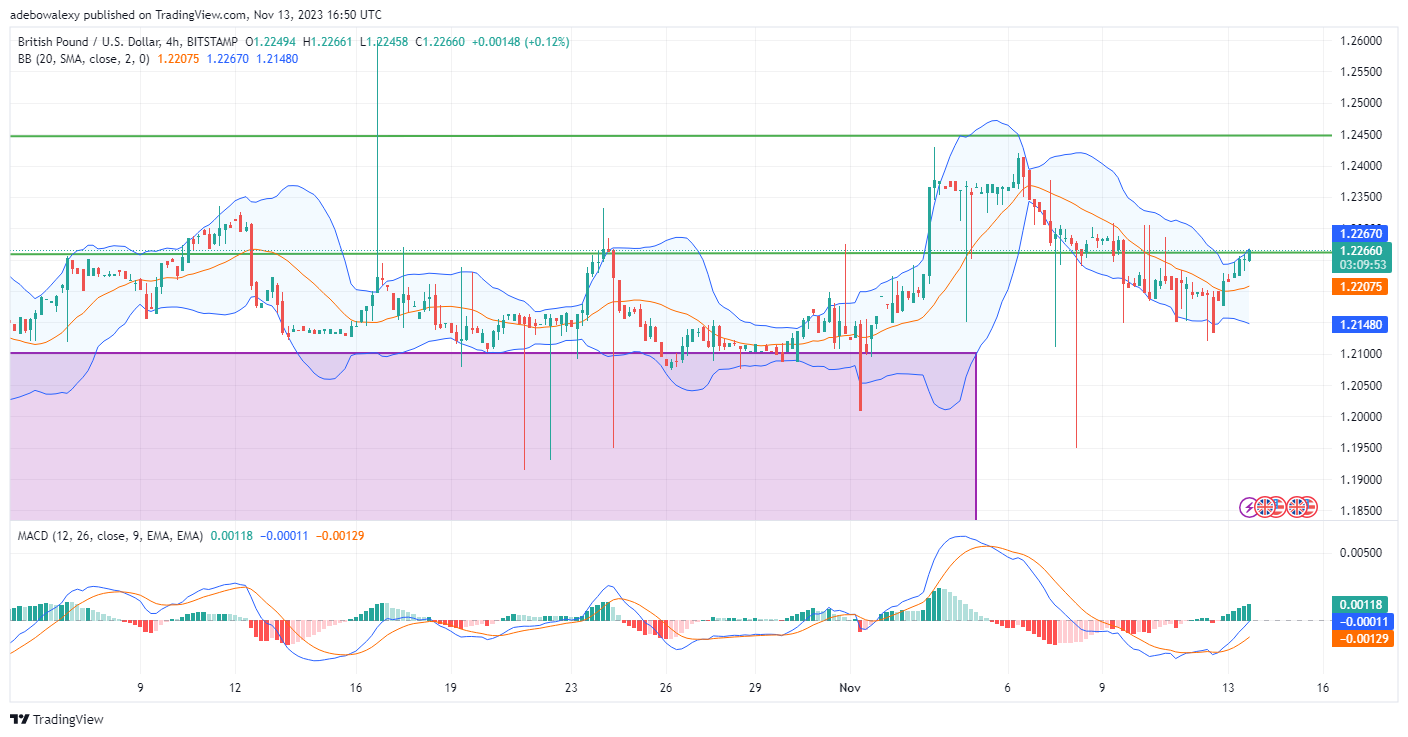
The GBP/USD 4-hour market has shed more light on how price movements have been developing in this market. Here, price action continues to trend upwards above the Bollinger Bands MA line. Meanwhile, the last price candle has kept the price of the pair above the 1.2259 mark. Simultaneously, bullish momentum has stayed on, as hinted by the MACD indicator.
On the MACD, the bars are growing taller above the 0.00 mark of the indicator as the indicator lines keep approaching the equilibrium level from below it. Consequently, indications in this market align with the hopes that price activities may extend a correction towards the 1.2300 mark ahead of the arrival of market-influencing fundamentals.
Do you want to take your trading to the next level? Join the best platform for that here.


Leave a Reply