USD/CAD Long-Term Analysis: Bullish
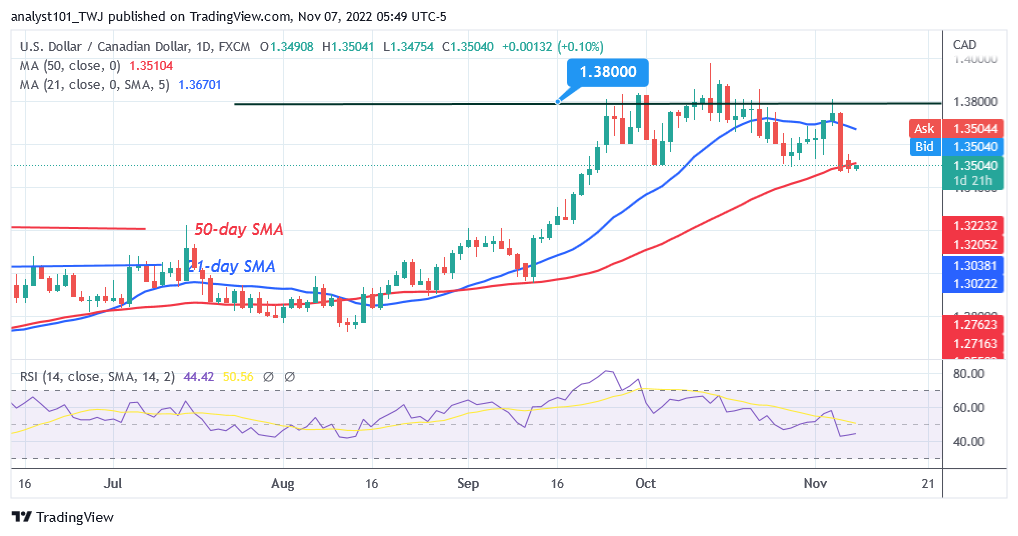
USD/CAD is in an ascending trend as it declines to level 1.3468. The positive movement since the upswing of September 26 has been stopped since the market has overbought. The currency pair has been fluctuating in price between 1.3500 and 1.3800 for the past month. The pair is currently below the moving average lines. The currency pair will presumably be forced to move in a range between the moving average lines. When the moving average lines are crossed, USD/CAD will trend. The 50-day line SMA is being fought by the bears as they try to breach it.
USD/CAD Indicator Analysis
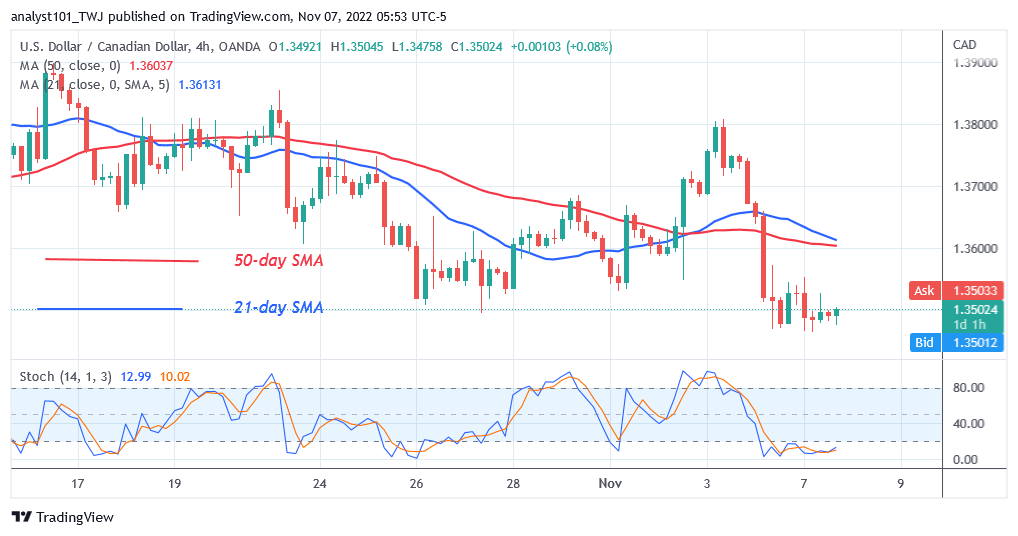
USD/CAD is at level 44 on the Relative Strength Index for period 14. It implies that the currency pair is in a downtrend and could continue to fall. The 50-day SMA is below the currency pair, indicating a potential fall. The daily stochastic’s level 20 is below the USD/CAD. The higher-sloping 21-day and 50-day SMA SMAs indicate an upswing.

Technical indicators:
Major Resistance Levels – 1.3300, 1.3400, 1.3500
Major Support Levels – 1.2300, 1.2200, 1.2100
What Is the Next Direction for USD/CAD?
The USD/CAD pair is trading within a range as it declines to level 1.3468. A break below or above the moving average lines will signal the market’s direction. The cost of the pair is at level 1.35059 at the time of writing. Additionally, the market has entered the oversold territory. The pressure to sell will soon cease.

Note: Forexschoolonline.com is not a financial advisor. Do your research before investing your funds in any financial asset or presented product or event. We are not responsible for your investing results


Leave a Reply