USD/CAD Long-Term Analysis: Bearish
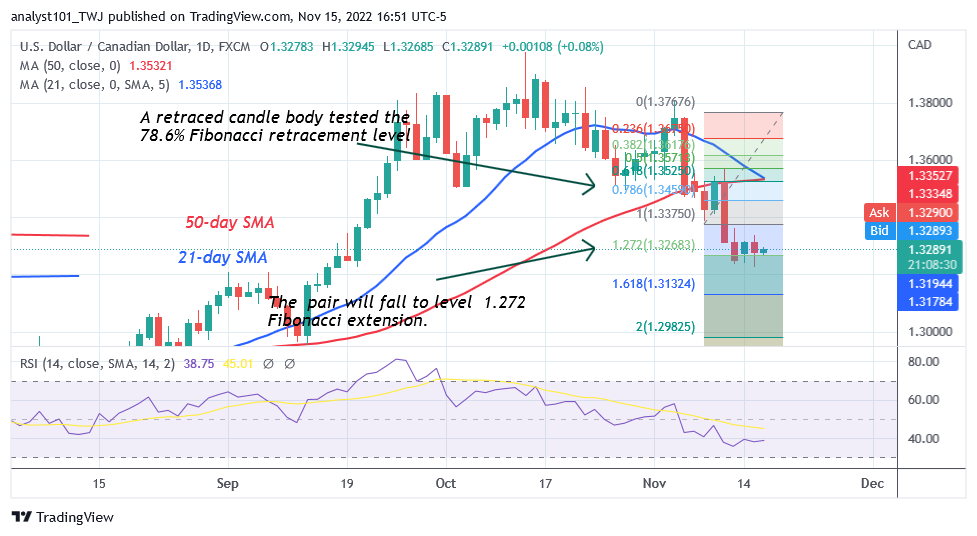
USD/CAD is in a downtrend as it consolidates above level 1.3235. The decrease was brought on by rejection from overhead resistances at level 1.3800. The market movement that came before the rise of September 26 encountered resistance around level 1.3800. After four failed efforts to break through the overhead barrier, the downturn started again. The pair corrected upward during the November 8 decline, and a candle body tested the 78.6% Fibonacci retracement level. The correction predicts that the pair will decline but turn around the Fibonacci extension level of 1.272 or level 1.3268.
USD/CAD Indicator Analysis
On the Relative Strength Index for period 14, USD/CAD is at level 38. It suggests that the currency pair is in a downward trend and might drop further. The decreasing trend is seen by the downward-sloping 21-day line SMA and the 50-day SMA. The pair is moving upward over the daily stochastic’s level of 40.

Technical indicators:
Major Resistance Levels – 1.3300, 1.3400, 1.3500
Major Support Levels – 1.2300, 1.2200, 1.2100
What Is the Next Direction for USD/CAD?
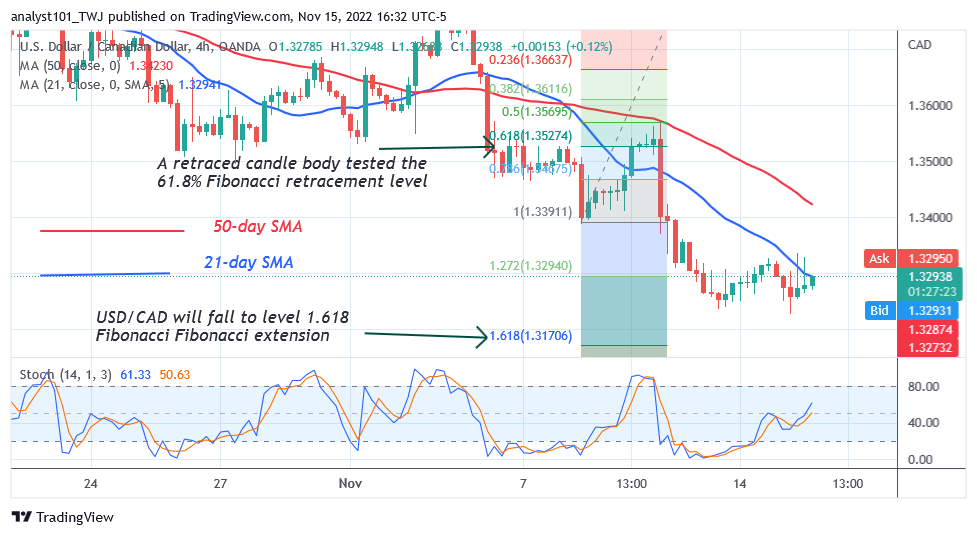
The USD/CAD pair has reached bearish exhaustion as it consolidates above level 1.3235. The 21-day line SMA is rejecting the rising movement. The pair corrected upward during the November 8 decline, and a candle body tested the 61.8% Fibonacci retracement level. According to the correction, the pair will drop to level 1.3170 or the Fibonacci extension level 1.618.

Note: Forexschoolonline.com is not a financial advisor. Do your research before investing your funds in any financial asset or presented product or event. We are not responsible for your investing results


Leave a Reply