USD/CAD price action has stayed flat for some time now. However, the pair appears to have taken a significant step toward higher price levels. Let’s further study this move.
Major Price Levels:
Top Levels: 1.3500, 1.3550, 1.3600
Floor Levels: 1.3450, 13400, 1.3350

USD/CAD About to Claim a Strong Support Level
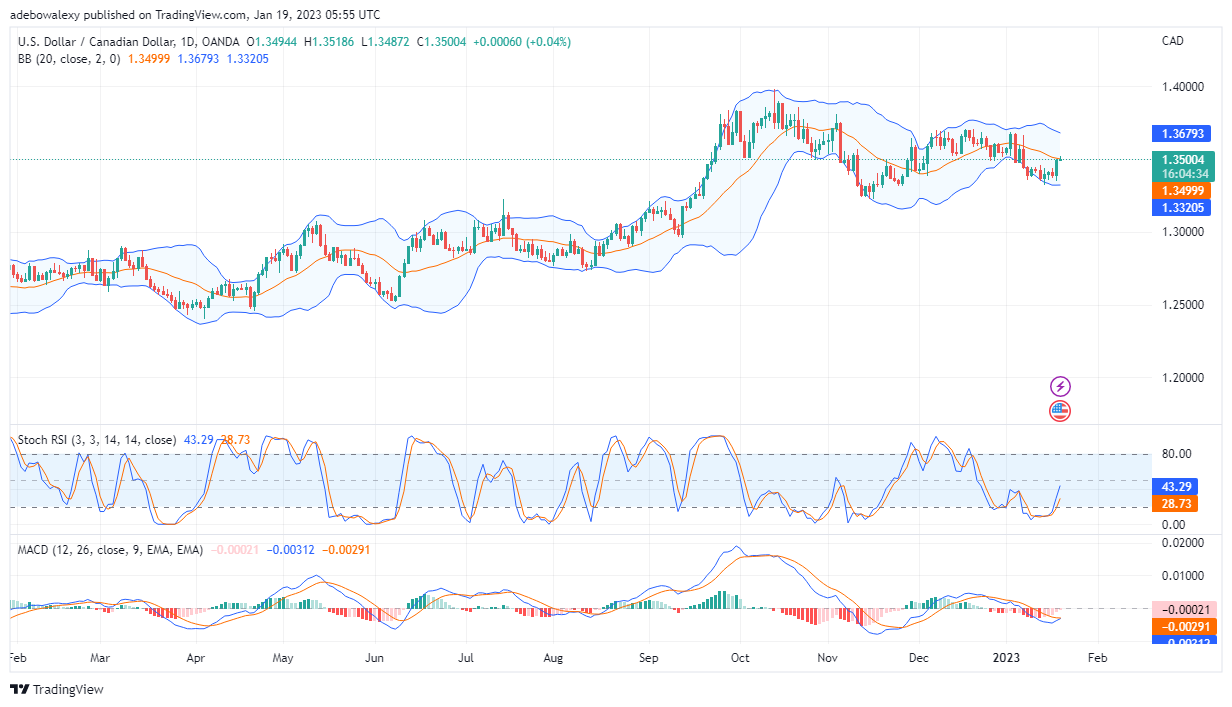
Price action in the USD/CAD market is making a significant attempt toward moving higher. Here, the last two price candles have pushed the pair’s price to the same level as the middle band of the Bollinger indicator. Also, the RSI has taken a sharp upside path, to indicate a gain in upside momentum. The lines of the MACD could also be seen converging below the equilibrium level of 0.00 for a crossover. Furthermore, the red bars on the MACD have turned pale, indicating a significant decrease in downward forces. Consequently, signs from technical indicators here are telling us that the price is more likely to continue moving upwards and past the Bollinger Band MA.

USD/CAD Price Movements Continue to Look Promising
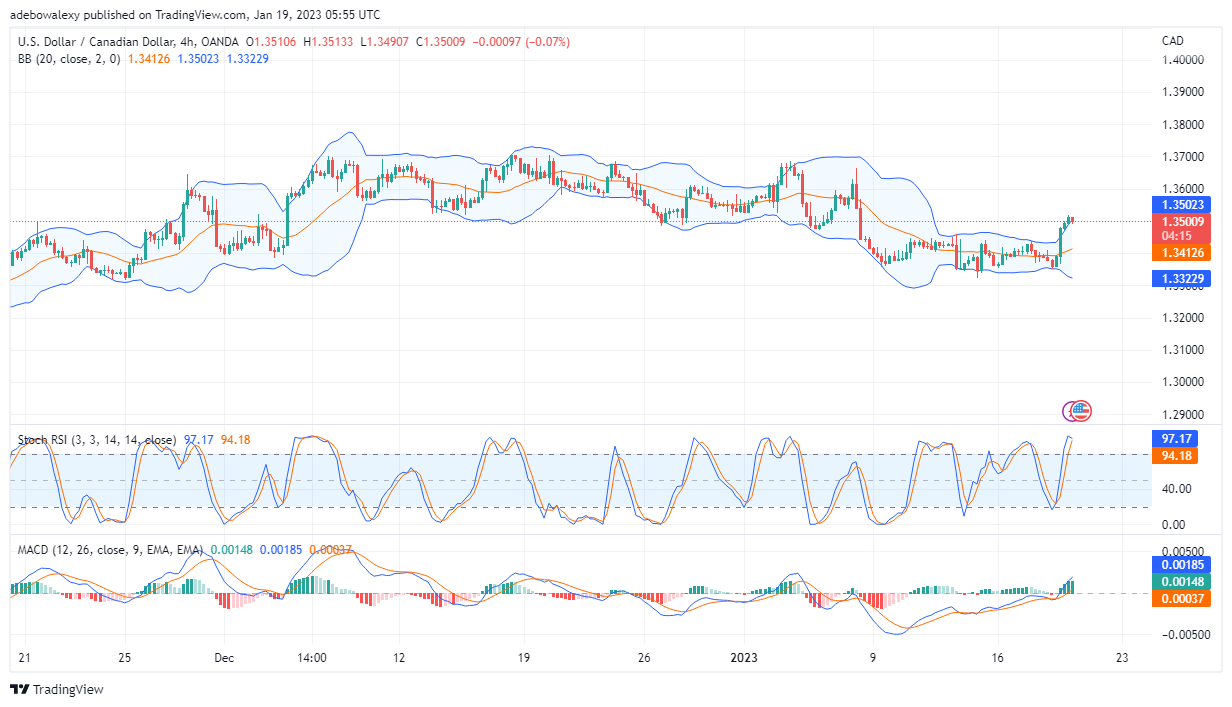
On the 4-hour chart, price action has moved beyond the middle limit of the Bollinger band. Furthermore, price action has even tested the upper limit of the Bollinger band indicator. Subsequently, this has led to a minor correction in price. However, from the looks of the technical indicators, USD/CAD price action is still looking good. Here, the MACD bars are solid green, and its lines are now above the 0.00 mark and still moving upwards. Consequently, this is foretelling that the upside momentum is still strong, and prices may keep moving upward. Likewise, the RSI lines have now reached the overbought zone. Although the lines of the RSI look bent toward each other, traders may not worry about this, nevertheless, they should stick to a good risk management plan. Summing up the signs here, we may predict that prices in this market may keep moving toward the 1.3650 mark.
Do you want to take your trading to the next level? Join the best platform for that here.


Leave a Reply