Price action in the USD/CAD market appears to be making minimal attempts at recovering above the 1.3600 price level. However, the attempt is on the way. So, let’s take a closer look at things to see the chances of this happening.
Important price Levels:
Top Levels: 1.3560, 1.3600, 1.3700
Bottom Levels: 1.3500, 1.3440, 1.3400

USD/CAD Is Rising Above an Important Support
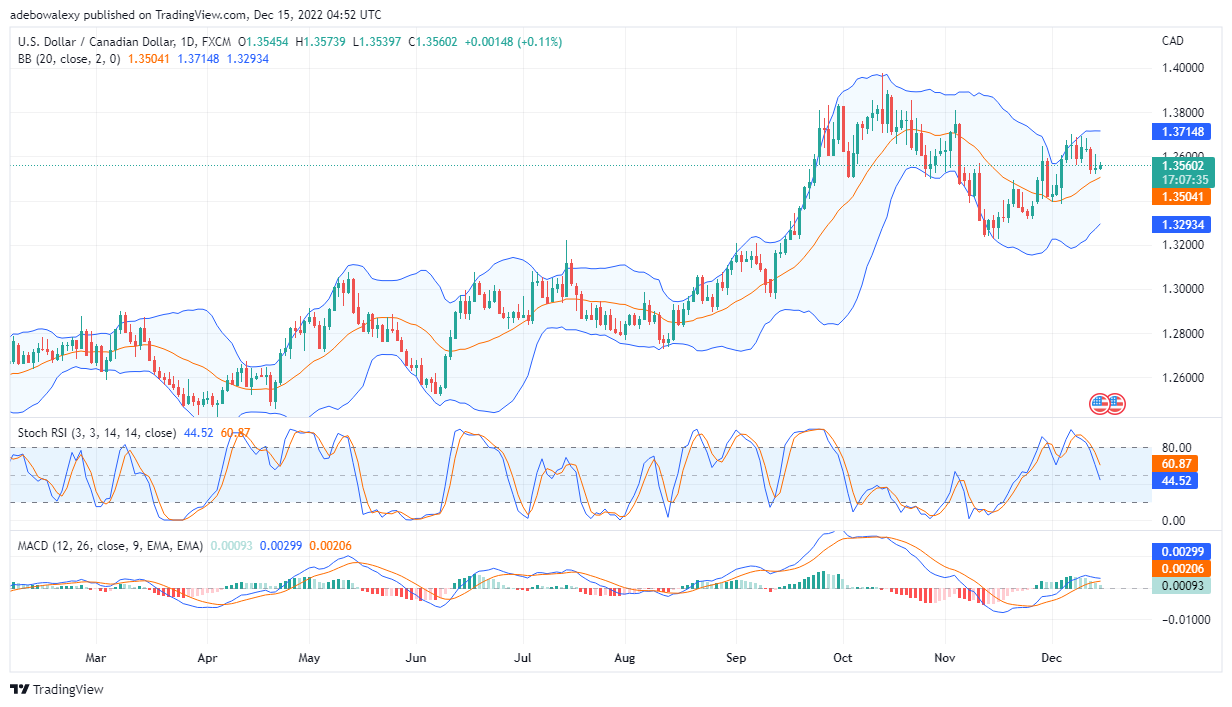
Price action in the USD/CAD market is rising upwards from above the Moving Average curve of the used Bollinger band indicator. This can be seen as two green candlesticks formed above the MA line. However, this rising is with low volatility. Additionally, the lines of the MACD indicator are still above the equilibrium point but are now moving closer to each other for a bearish crossover. Furthermore, the RSI lines seem not to have sensed the minimal profits gathered in the previous session till now. Consequently, the lines of this Indicator continue to plunge into the oversold area. Therefore, traders can predict that only minimal profits may be recorded in this market.

USD/CAD May Not Hold Significant Profits
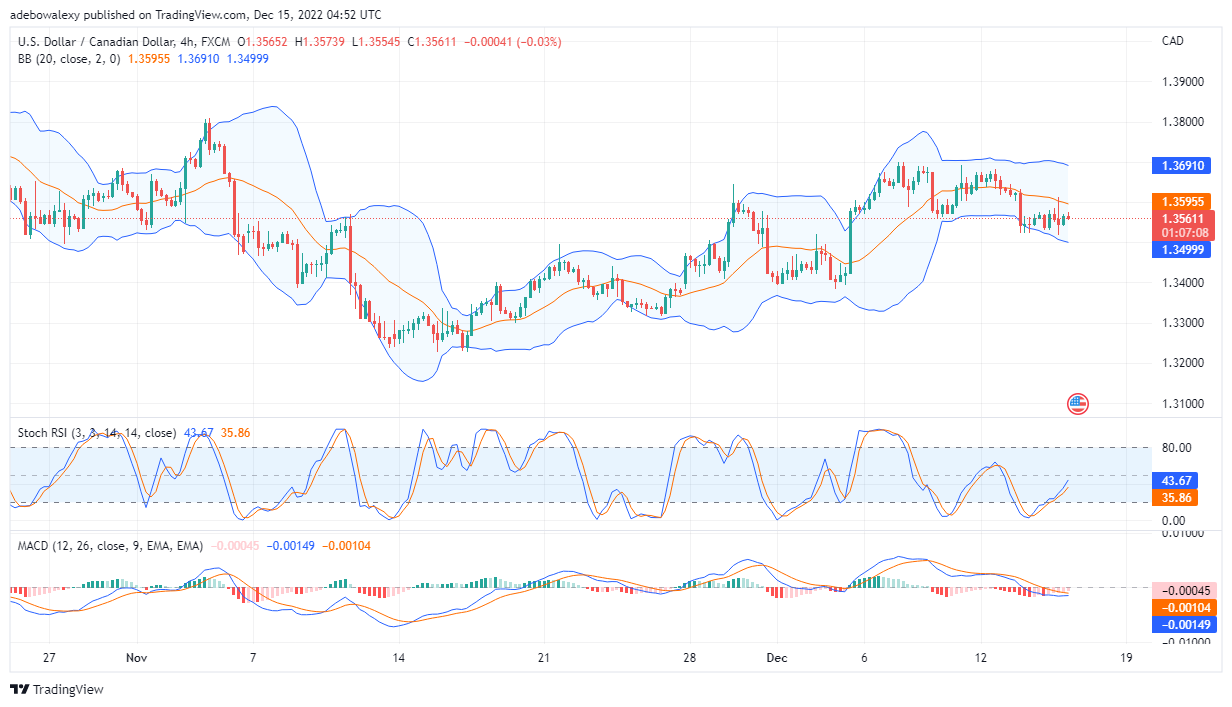
On the USD/CAD four-hour market, over the last 8 trading sessions, price action has been almost flat and sideways. This has posed only very little profit for even short-term traders. Also, the lines on the MACD indicator have fallen under the equilibrium level. However, the lines of this Indicator seem to be moving closer to each other, in what seems like an attempt to deliver a bullish crossover. Additionally, the Stochastic RSI indicator lines are still rising towards the overbought region: even when a bearish price candle just showed up for this session. Going by indications coming from technical indicators, it appears that minimal upside strength is building up. Consequently, this aligns with the idea that only minimal minimal profits may be recorded around the 1.3600 price mark.
Do you want to take your trading to the next level? Join the best platform for that here.


Leave a Reply