USD/CAD Long-Term Analysis: Bearish
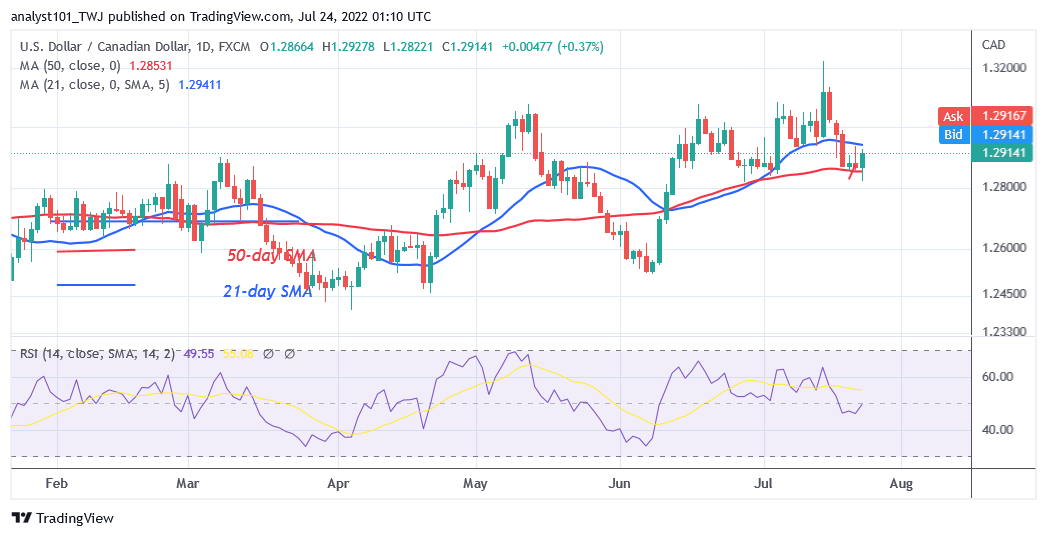
USD/CAD is in a downward correction as it is confined between levels 1.2840 and 1.3000. The currency pair is trading between the moving average lines. The pair is trading above the 50-day line SMA but below the 21-day line SMA. The market will resume trending when price breaks the moving average lines. For instance, USD/CAD will resume an uptrend when price breaks above the 21-day line SMA. The market will rise and reach the previous high of 131.00. On the other hand, if the bears break below the 50-day line SMA, the market will decline to level 1.2520. In the meantime, the pair is rising and approaching the high of level 1.2914.
USD/CAD Indicator Analysis
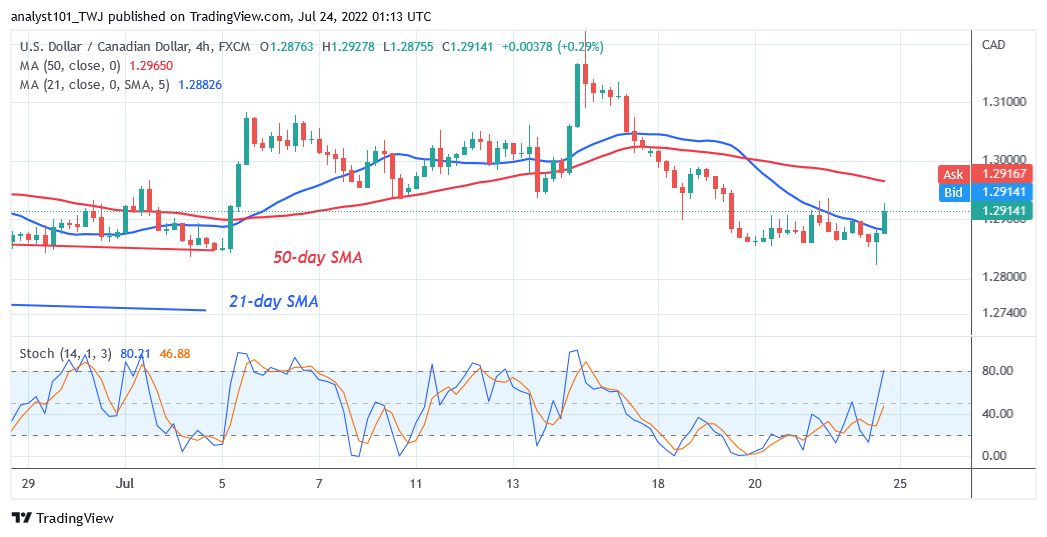
USD/CAD is at level 49 of the Relative Strength Index for period 14. It indicates that there is a balance between supply and demand. The currency pair is above the 50-day line SMA but below the 50-day line SMA indicating a possible range-bound move of the market. USD/CAD is above the 40% range of the daily stochastic. The pair is in a bullish momentum and may further rise. The 21-day line SMA and 50-day line SMA are sloping upward indicating the uptrend.

Technical indicators:
Major Resistance Levels – 1.3300, 1.3400, 1.3500
Major Support Levels – 1.2300, 1.2200, 1.2100
What Is the Next Direction for USD/CAD?
USD/CAD is in a range-bound move but is confined between levels 1.2840 and 1.3000. The pair will be confined between the moving average lines. A break below or above the moving average lines will determine the direction of the market.

Note: Forexschoolonline.com is not a financial advisor. Do your research before investing your funds in any financial asset or presented product or event. We are not responsible for your investing results


Leave a Reply