USD/CAD Long-Term Analysis: Bearish
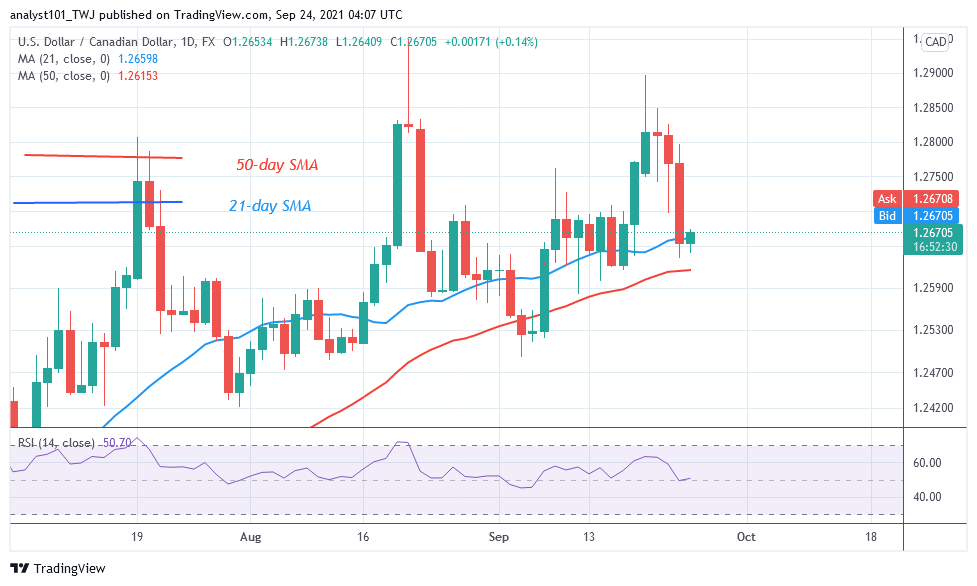
USD/CAD pair has been falling for the past four days. It fell to the low of level 1.2633 and above the 21-day SMA. A bullish candlestick is forming above the 21-day AMA. The upward move will commence if the 21-day SMA support holds. Conversely, if price breaks below the moving averages, another round of selling pressure will resume. Meanwhile, USD/CAD is trading at 1.2669 at the time of writing.
USD/CAD Indicator Analysis
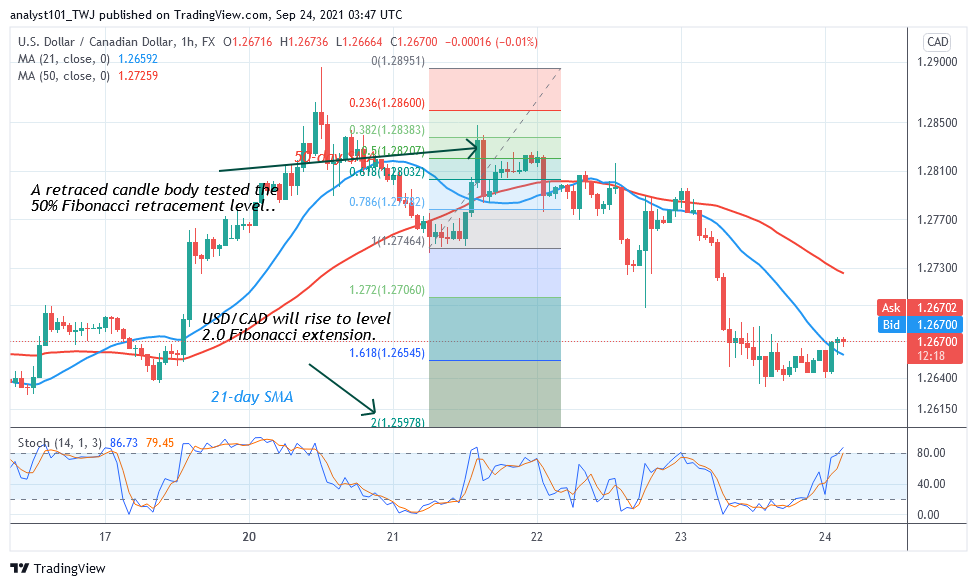
The currency price is above the 21-day and 50-day SMAs suggesting a possible upward move. A break below the moving averages will mean resumption of selling pressure. The 21-day and 50-day SMAs are pointing northward indicating an uptrend. The pair is at level 50 of the RSI period 14. It indicates that there is a balance between supply and demand. The market is above the 80% range of the daily stochastic. It is in a bullish momentum but has reached the overbought region.

Technical indicators:
Major Resistance Levels – 1.3300, 1.3400, 1.3500
Major Support Levels – 1.2300, 1.2200, 1.2100
What Is the Next Direction for USD/CAD?
On the 1-hour chart, the currency pair has exhausted its selling pressure. It also consolidated above level 1.2645 for two days. Thirdly, the bullish momentum has reached an overbought region. The currency pair is likely to decline as it faces resistance at the recent high. Therefore, the upward move is doubtful.

Note: Forexschoolonline.com is not a financial advisor. Do your research before investing your funds in any financial asset or presented product or event. We are not responsible for your investing results


Leave a Reply