The USD/CAD has continued to dive after available fundamentals have failed to attract investors. The US Consumer Credit Change data arrived lower than market anticipations. This allowed the Canadian dollar to keep gaining against the US dollar, creating a headwind for the pair.
Key Price Levels:
Resistance Levels: 1.3800, 1.3900, and 1.4000
Support Levels: 1.3700, 1.3600, and 1.3500

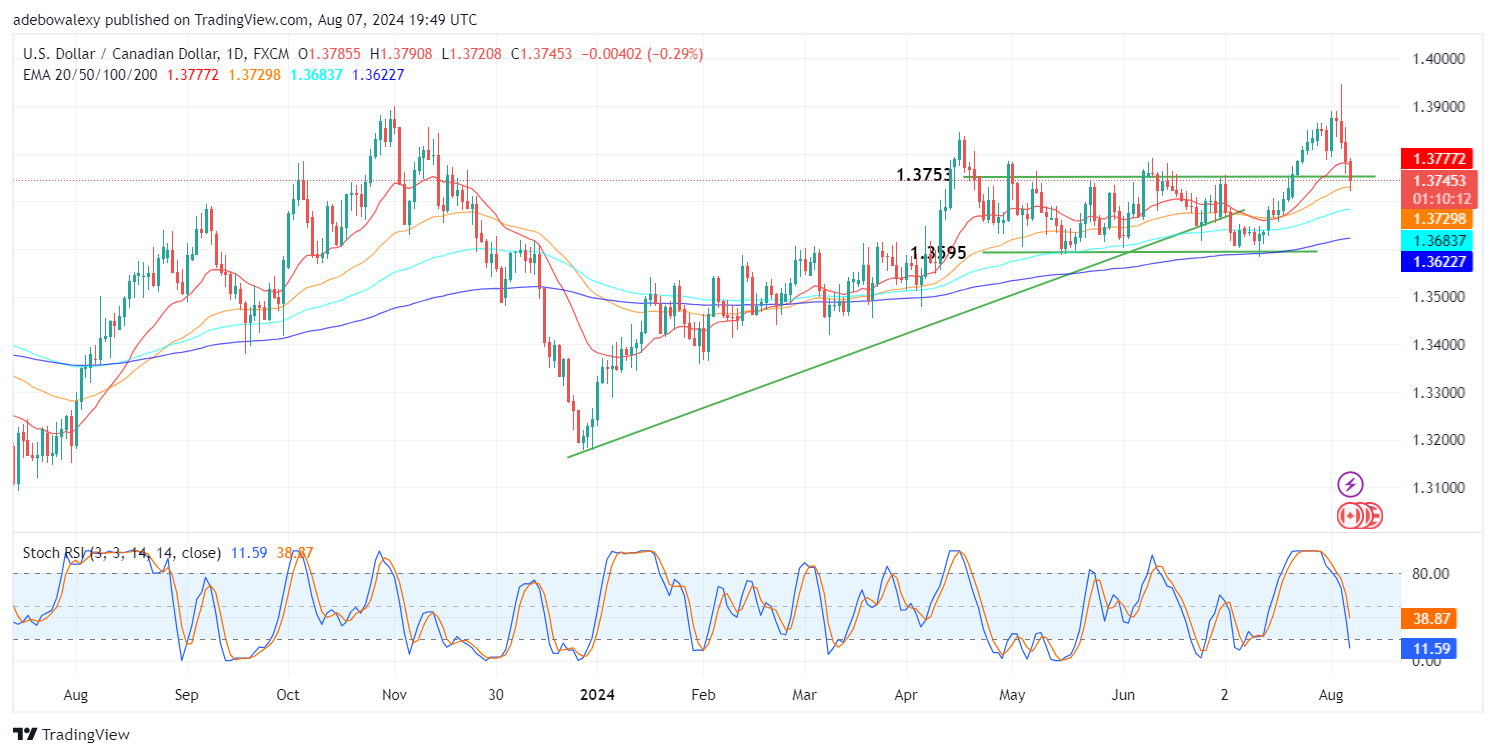
USD/CAD Price Dips Strongly Below the 20-Day EMA Line
The USD/CAD fell sharply after the pair jabbed through the resistance at the 1.3900 mark two sessions ago. Afterward, the market continued downwards and fell through the 20-day Exponential Moving Average (EMA) curve.
The lower shadow of the last price candle on this chart suggests that some upside contractions have occurred, bringing the market back above the 50-day EMA line. Furthermore, the Stochastic Relative Strength Index (SRSI) has continued to fall sharply into the oversold region. Consequently, this suggests that steeper falls may be seen in this market.

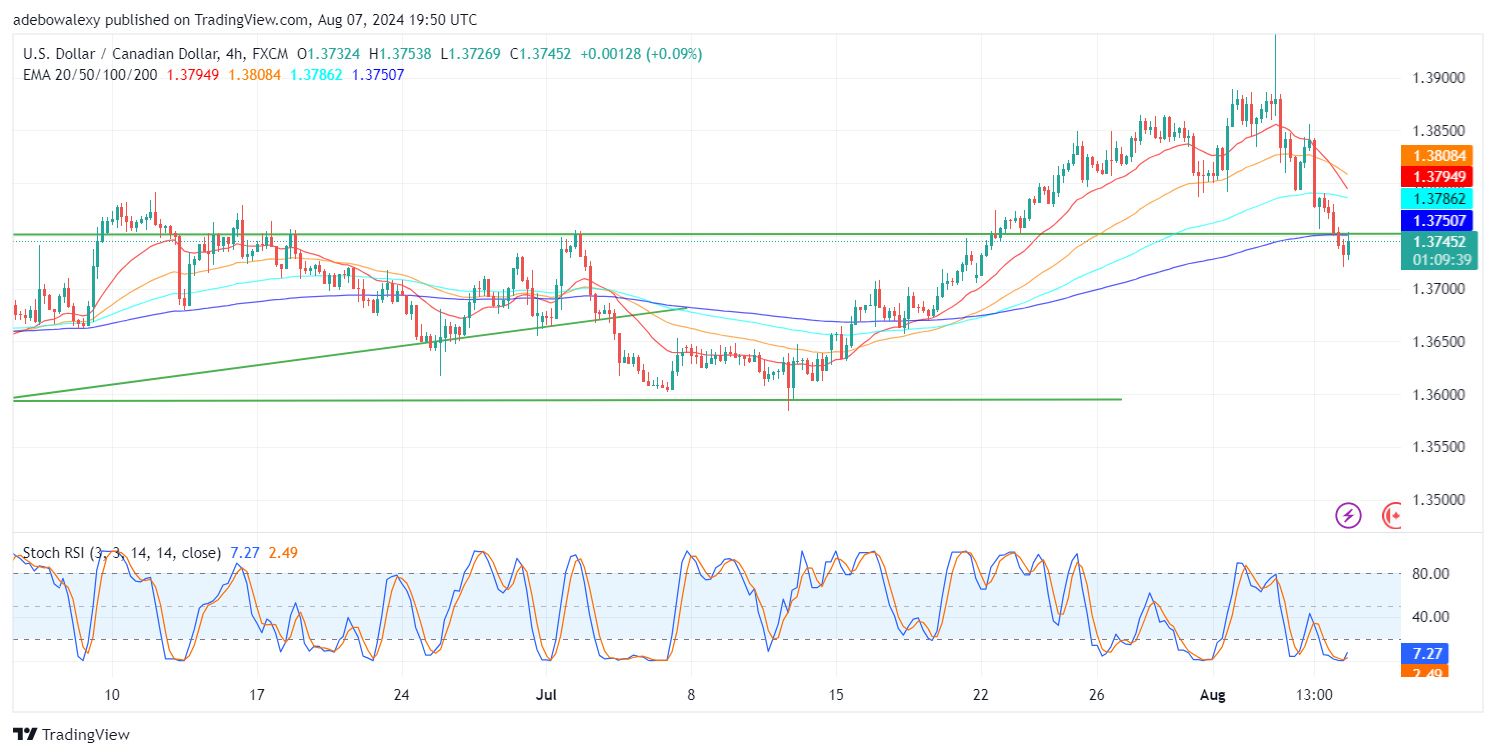
USD/CAD Stays Vulnerable Despite Seeing Some Upside Corrections
Coming to a USD/CAD market of 4 hours, it can be seen that price activity has corrected moderately upwards. Nevertheless, price movement remains below all the EMA lines. These mentioned EMA lines appear to be converging above the price action.
Meanwhile, the SRSI indicator lines maintain an upward trajectory due to the seen upside correction in the oversold region. Be that as it may, the fact that the market is below the EMA lines poses a strong threat to any upside correction. Therefore, trades may still want to target the 1.3700 price level.
Do you want to take your trading to the next level? Join the best platform for that here.


Leave a Reply