USD/CAD Long-Term Analysis: Bearish
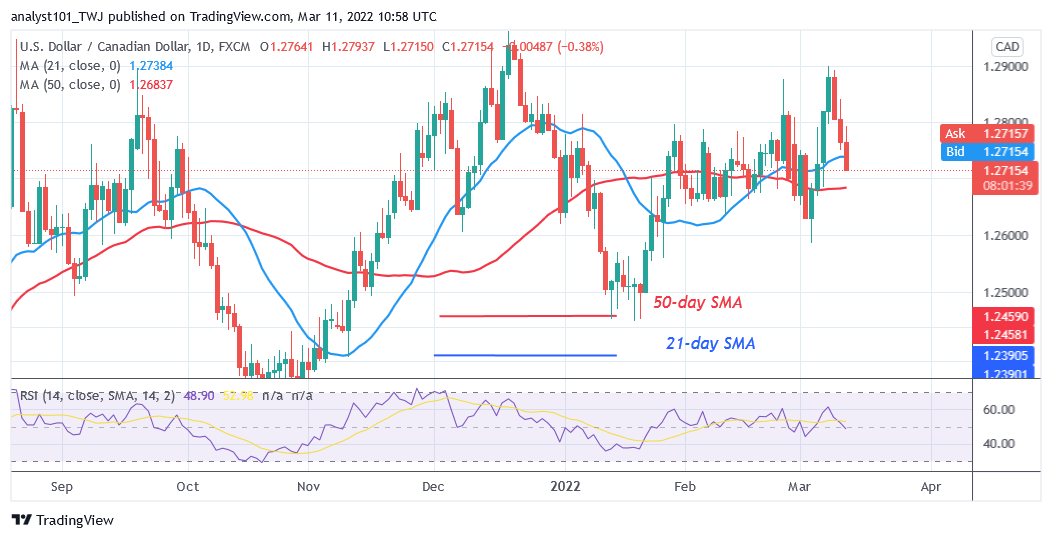
USD/CAD is in a sideways trend since July 2021 as it reaches bearish exhaustion. Presently, the currency pair is falling after a rejection from the high of 1.2900. The bears have broken below the 21-day line moving average and it is approaching the 50-day line moving average. The pair will resume a downtrend if price breaks below the 50-day line moving average. The pair will further decline to level 1.2600 or 1.2500 price level. On the other hand, if price holds above the 50-day line moving average, USD/CAD will be compelled to a range-bound move between the moving averages.
USD/CAD Indicator Analysis
USD/CAD is at level 48 of the Relative Strength Index for period 14. The pair is still in the downtrend zone and below the centerline 50. The 21-day SMA and the 50-day SMA are sloping horizontally indicating the sideways trend. The pair is below the 20% range of the daily stochastic. The market has fallen to the oversold region. The selling pressure is likely to reach bearish exhaustion.

Technical indicators:
Major Resistance Levels – 1.3300, 1.3400, 1.3500
Major Support Levels – 1.2300, 1.2200, 1.2100
What Is the Next Direction for USD/CAD?
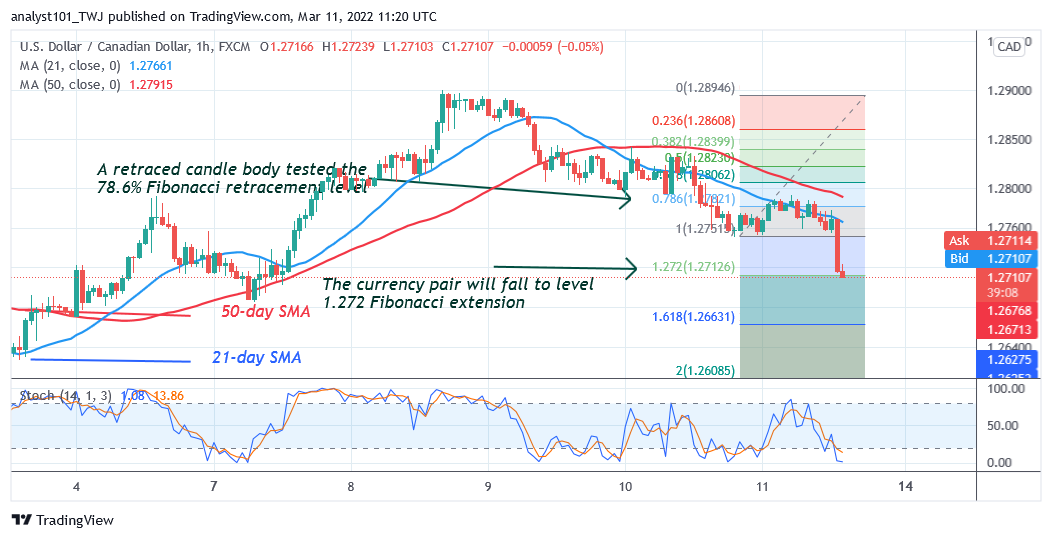
On the 1-hour chart, USD/CAD is in a downtrend as it reaches bearish exhaustion. The pair has broken below the moving averages. Meanwhile, on March 10 downtrend; a retraced candle body tested the 78.6 % Fibonacci retracement level. The retracement suggests that the currency pair will fall but reverse at level 1.272 Fibonacci extension or level 1.2712. From the price action, USD/CAD has broken below level 1.272 Fibonacci extension

Note: Forexschoolonline.com is not a financial advisor. Do your research before investing your funds in any financial asset or presented product or event. We are not responsible for your investing results


Leave a Reply