USD/CAD Long-Term Analysis: Bullish
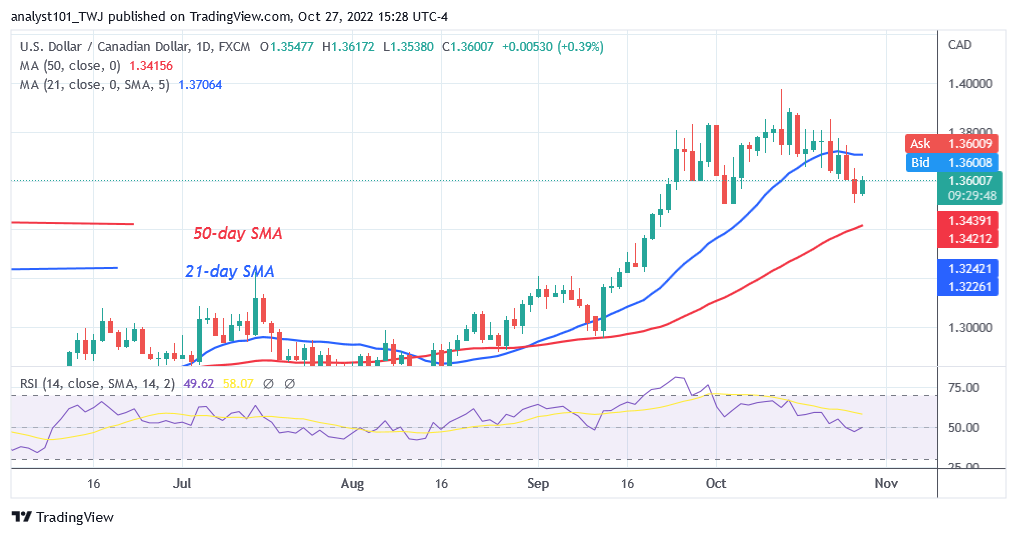
USD/CAD is in a sideways trend as buyers recoup above the 1.3508 low. On September 30 uptrend; the bullish momentum was terminated at the high of level 1.3800. Buyers could not sustain the current uptrend. On October 4, the bears pushed the pair to the low of level 1.3502. The uptrend resumed as bulls bought the dips. The pair rallied to the high of level 1.3977 but faced another selling pressure at the recent high. Today, USD/CAD has fallen to the low of level 1.3507 and has resumed fluctuation between the moving average lines. The currency pair will trend again when the moving average lines are breached.
USD/CAD Indicator Analysis
USD/CAD is at level 50 of the Relative Strength Index for period 14. It indicates that there is a balance between supply and demand. The price bars are between the moving average lines, which indicate that the pair will be in a range-bound move for a few days. It is in a bullish momentum above the 50% range of the daily Stochastic.

Technical indicators:
Major Resistance Levels – 1.3800, 1.3900, 1.4000
Major Support Levels – 1.3400, 1.3300, 1.3200
What Is the Next Direction for USD/CAD?
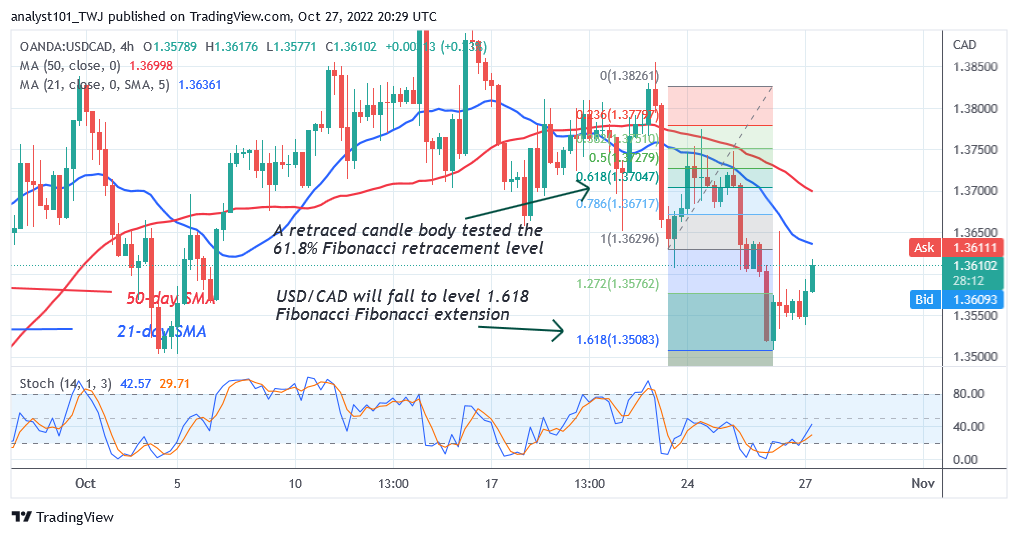
USD/CAD is in a downtrend as buyers recoup above the 1.3508 low. The pair is correcting upward to retest the moving average lines. On October 21 downtrend, the pair corrected upward and a candle body tested the 61.8% Fibonacci retracement level. The correction implies that USD/CAD will fall to level 1.618 Fibonacci Fibonacci extension or level 1.3508.

Note: Forexschoolonline.com is not a financial advisor. Do your research before investing your funds in any financial asset or presented product or event. We are not responsible for your investing results


Leave a Reply