USD/CAD Long-Term Analysis: Bullish
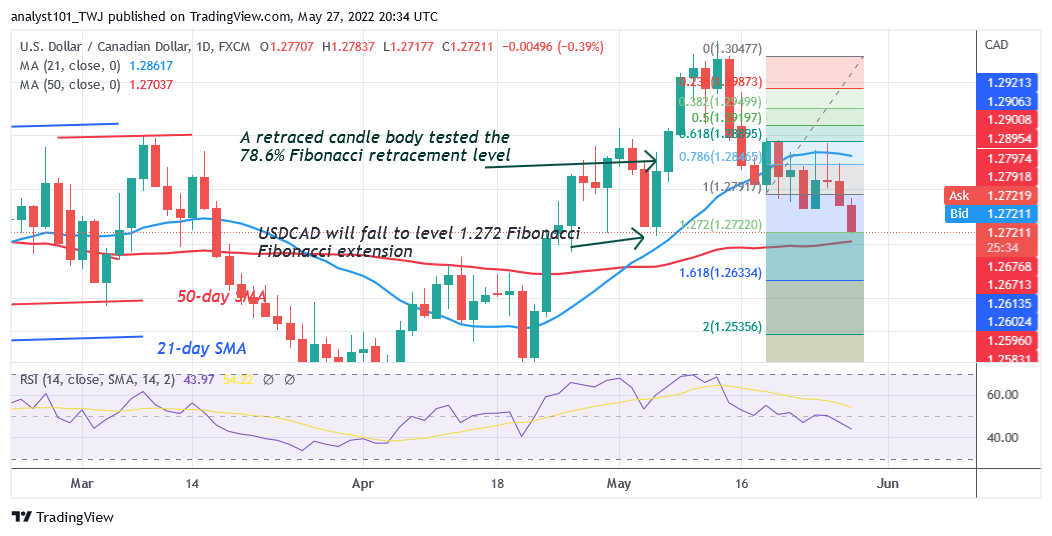
USD/CAD is in a downward move after the formation of a bearish double top. The currency price broke below the 21-day line SMA but approaches the 50-day line SMA. The pair will be compelled to a range-bound move if it finds support above the 50-day line SMA. Meanwhile, on May 18 downtrend; a retraced candle body tested the 78.6% Fibonacci retracement level. The retracement suggests that the currency pair will fall to level 1.618 Fibonacci extension or level 1.2722. From the price action, USD/CAD has retested the Fibonacci extension. It is unclear if the support will hold.
.
USD/CAD Indicator Analysis
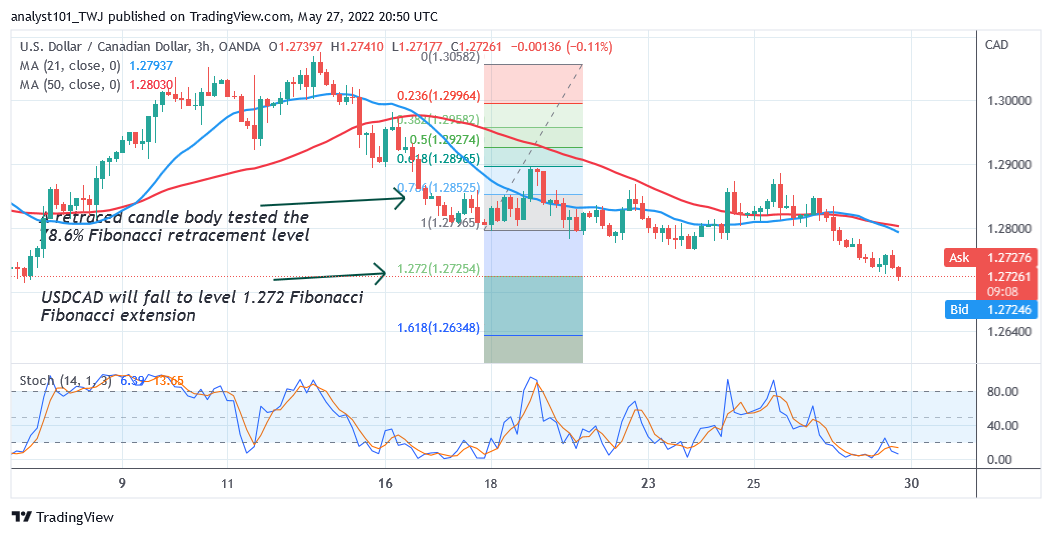
USD/CAD has fallen to level 44 of the Relative Strength Index for period 14. The pair is trading now in the bearish trend zone and is capable of a further downward move. The currency price bars are above the 50-day line SMA but below the 21-day line SMA indicating a possible range bound move of the pair.USD/CAD is below the 20% range of the daily stochastic. The market has reached the oversold region.

Technical indicators:
Major Resistance Levels – 1.3300, 1.3400, 1.3500
Major Support Levels – 1.2300, 1.2200, 1.2100
What Is the Next Direction for USD/CAD?
The pair is in a downtrend after the formation of a bearish double top. USD/CAD fell to the oversold region of the market. Meanwhile, on May 18 downtrend; a retraced candle body tested the 78.6% Fibonacci retracement level. The retracement suggests that the currency pair will fall to level 1.618 Fibonacci extension or level 1.2634.

Note: Forexschoolonline.com is not a financial advisor. Do your research before investing your funds in any financial asset or presented product or event. We are not responsible for your investing results


Leave a Reply