USD/CAD Long-Term Analysis: Bullish
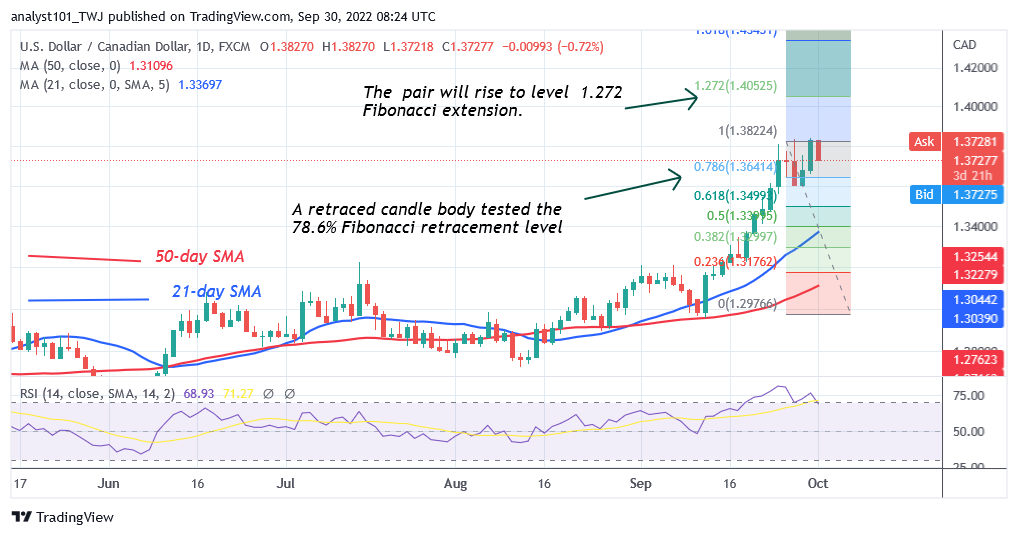
USD/CAD is trading in the bullish trend zone after a rally to level 1.3800 overbought region. The current uptrend reached the high of level 1.3833 but was repelled. On September 27, the currency pair made a minor retracement and commenced fluctuations below the resistance level. The pair will resume an uptrend if the current resistance is breached. Otherwise, the downtrend will commence below the moving average lines. On September 27 uptrend, the pair retraced and the retraced candle body tested the 78.6% Fibonacci retracement level. This gives the impression that the pair will rise and reverse at level 1.272 Fibonacci extension or level 1.4052.
USD/CAD Indicator Analysis
USD/CAD has fallen to level 66 of the Relative Strength Index for period 14. The pair is capable of a further upward move as the price bars are above the moving average lines. USD/CAD has fallen below the 20% range of the daily stochastic. This implies that the market has reached the oversold region . The selling pressure has reached bearish exhaustion.

Technical indicators:
Major Resistance Levels – 1.3800, 1.3900, 1.4000
Major Support Levels – 1.3400, 1.3300, 1.3200
What Is the Next Direction for USD/CAD?
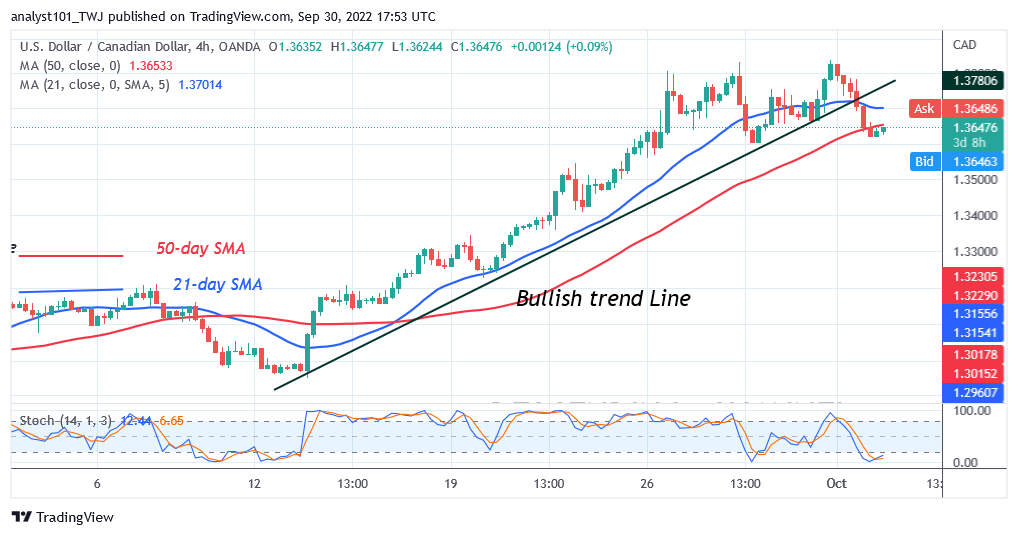
On the 4-hour chart, USD/CAD is in a downtrend after a rally to level 1.3800 overbought region. Buyers retested the resistance at level 1.3800 on three occasions but failed to break above it. The price will rally to level 1.4000 if buyers overcome the resistance at 1.3800. However, the price movement will be short-lived as the market reaches the overbought region. USD/CAD will resume a downtrend if the pair turns from the current resistance level.

Note: Forexschoolonline.com is not a financial advisor. Do your research before investing your funds in any financial asset or presented product or event. We are not responsible for your investing results


Leave a Reply