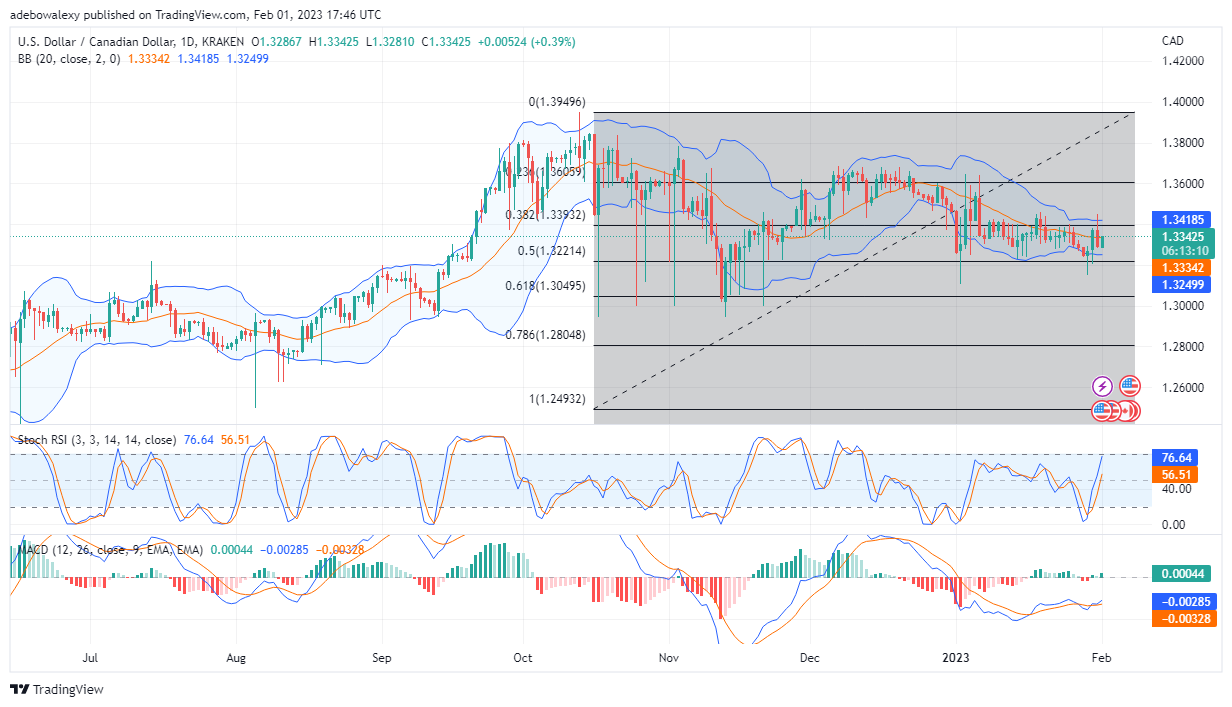
The struggle between buyer and seller over price control continues to restrain USD/CAD under the 1.3393 price mark. Nevertheless, with this session, buyers are now challenging the price mark of 1.3343. Will price action succeed in breaking significantly above this level? Let’s find out.
Major Price Levels:
Top Levels: 1.3343, 1.3380, 1.3420
Floor Levels: 1.3323, 1.3300, 1.3270

USD/CAD Bulls Are Swimming Against the Tide
Price action in the daily USD/CAD market is currently pushing back against headwinds. This could be observed as a green candlestick appears for this session, in what seems like a slight downward price channel since around mid-January 2023. However, in this trading session, price action has moved back up and is now at the 1.3343 mark. At the same time, the MACD indicator lines are now showing gradual but fragile gains in upside momentum. Meanwhile, the RSI indicator lines can be seen ramping very quickly towards the overbought level at the 76.64 and 56.51 marks. All the signs picked up in this market point out that the price will move further upward in this session.

USD/CAD Price Action Makes a Smooth U-turn Off Strong Support
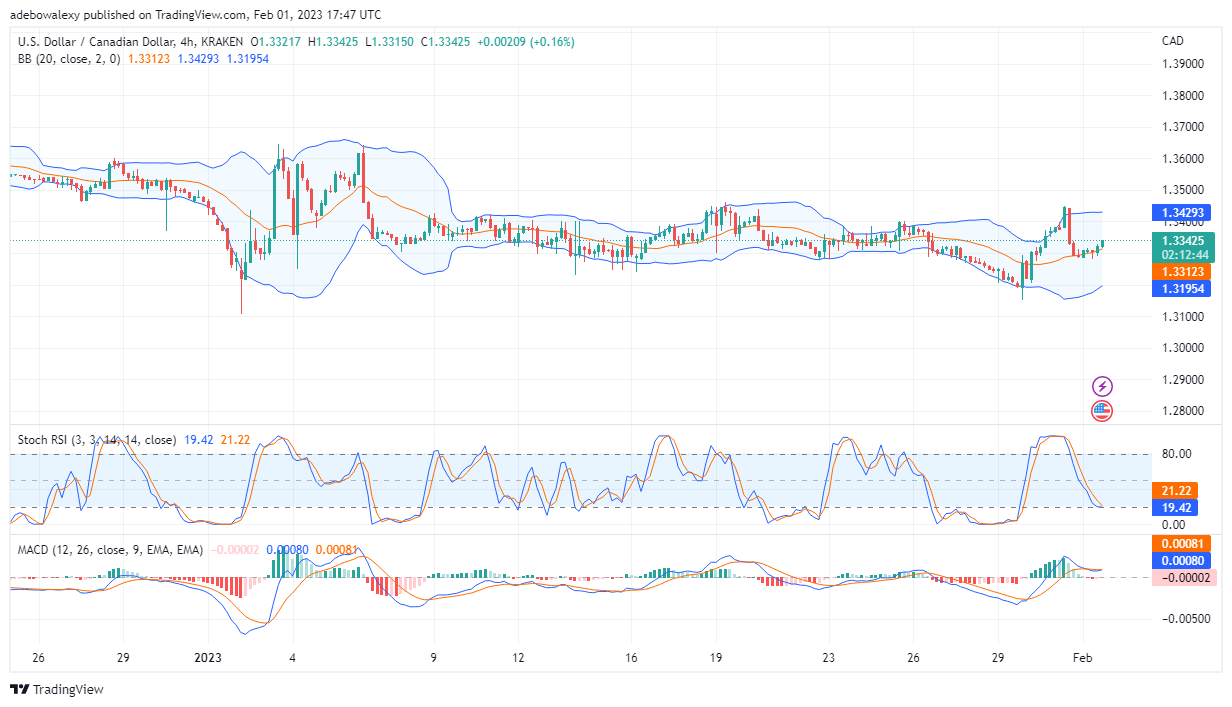
The price action on the hourly market has started a gradual movement off the middle limit of the Bollinger band. Consequently, it appears as if the price may rise significantly from this point since such behavior aligns with the idea of a price upside move. Also, the RSI curves are now preparing for an upside crossover at levels 21.22 and 19.42. Likewise, the MACD lines have quickly performed an upside crossover. Also, it could be seen that the short red candlestick, below the equilibrium level, is now pale and vanishing into the 0.00 level. Going by the signs emanating from the technical indicators, we can predict that the price will move upward from here. However, one may anticipate that the USD/CAD price may not move very far, perhaps it will arrive at around 1.3400.
Do you want to take your trading to the next level? Join the best platform for that here.


Leave a Reply