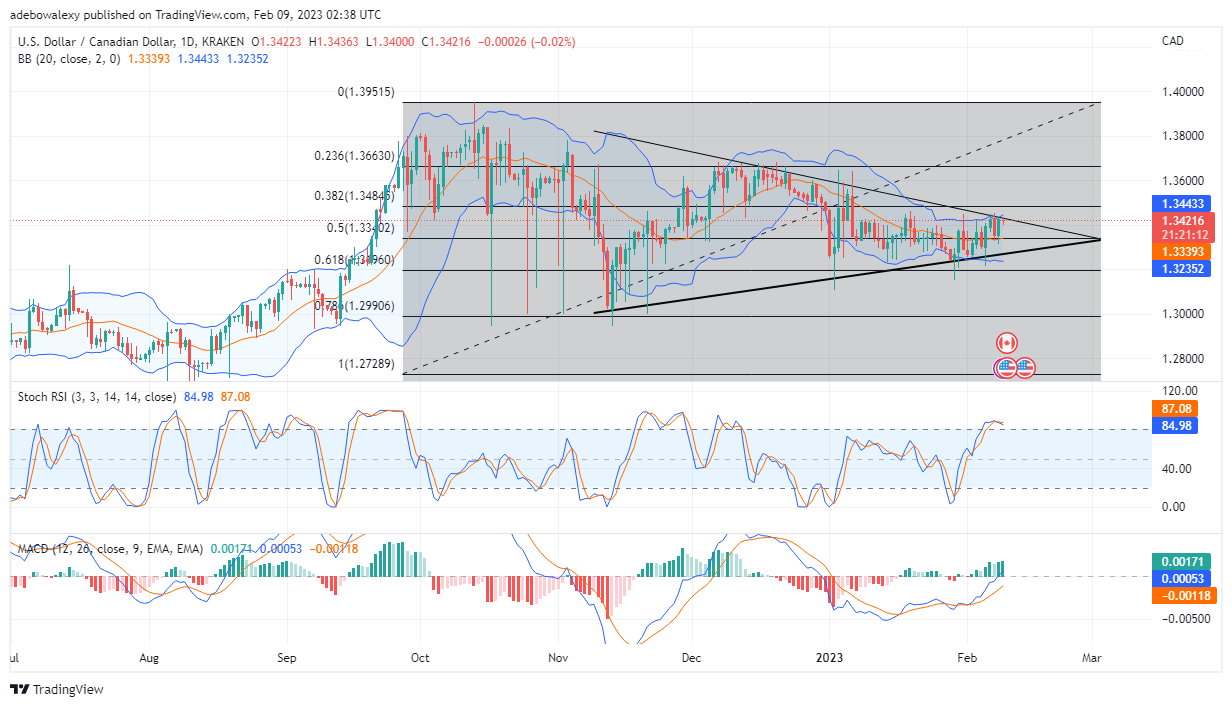
USD/CAD price action looks fragile as it moves above the 1.3340 mark. Also, trading indicators seem to be revealing that price action is treading on thin ice, as the pair possesses some downside propensity.
Major Price Levels:
Top Levels: 1.3462, 1.3482, 1.3510
Floor Levels: 1.3422, 1.3400, 1.3380

USD/CAD Bulls Look Actively Engaged
The price action on the USD/CAD daily chart seems to have started the day’s trading on a bad note. However, the ongoing session has only a very minimal effect on previous upside achievements. Nevertheless, as trading continues, losses may grow significantly. The last price candlestick here is a red Doji price candlestick which portrays that the bears are encountering some resistance from the bulls. Nonetheless, price action is still above the middle limit of the used Bollinger indicator, which brings some relief to downside worries. Meanwhile, the RSI lines have given a bearish crossover in the overbought region, and are now moving slightly downward. The MACD indicator is still telling us that upside forces are gaining strength, consequently, this may result in USD/CAD returning to its upside path.

USD/CAD May Be Preparing to Retrace Lower Support
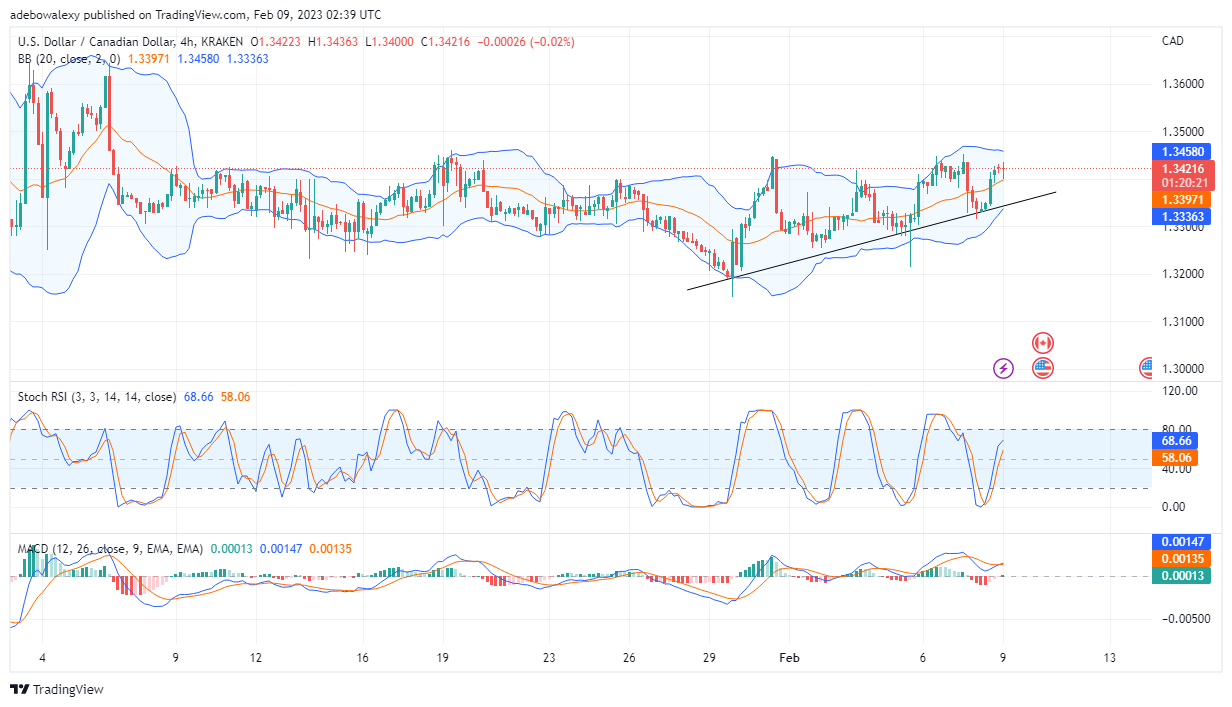
The USD/CAD price action has moved significantly off the upward-sloping trendline on the 4-hour market in the previous session. However, it now appears as if it is already testing lower support. The last price candle here is now testing the MA of the applied Bollinger band indicator. Furthermore, the Stochastic RSI indicator lines are still mostly projected upward, only with a slight curvature in the leading line. Similarly, the MACD indicator has just completed an upward crossover. Therefore, this market is still a mix of the downside and upside possibilities. Consequently, traders should maintain a good risk management plan as they project the pair’s price eventually reaching the 1.3490 mark.
Do you want to take your trading to the next level? Join the best platform for that here.


Leave a Reply