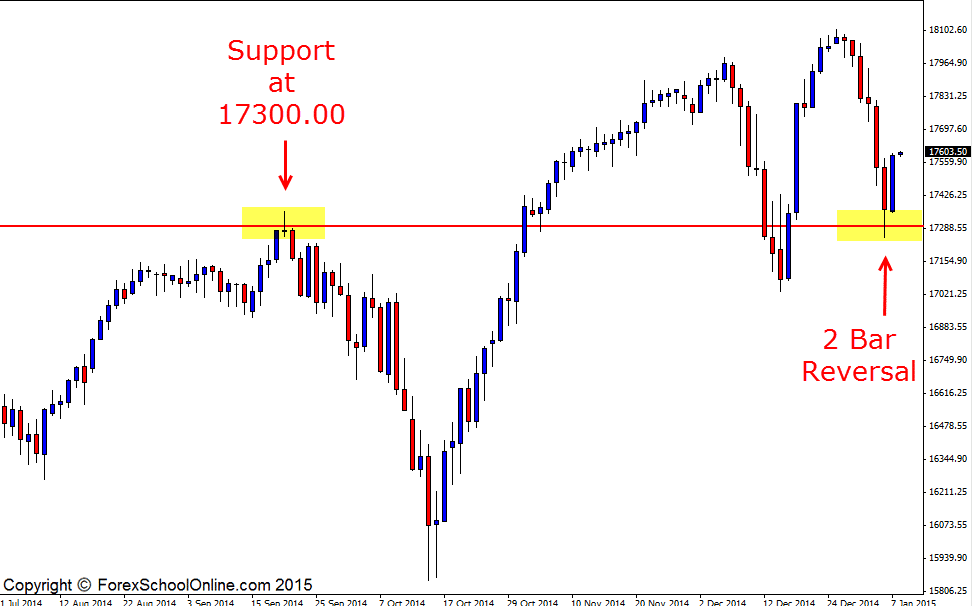
The US30 has fired off a bearish 2 bar reversal on the daily price action chart. This 2 bar reversal is down at the low and rejecting the daily support area of 17300 which had been a previous resistance area that price had moved higher into and formed a bearish pin bar. This is the second time price has tested this daily support level. The first time price made a test it tried to break lower and ended up resulting in a false break with price snapping back and moving higher.
Whilst price has been in an overall up-trend in this market, in recent times we can see on the daily chart below that price has been stuck in a bit of sideways action and not moving in a clear trend for the time being. For the up-trend to continue a solid break out of this continuation phase would need to take place and for price to once again start making fresh new higher highs.
If price can break the 2 bar reversal high and then gain momentum, the first trouble area overhead looks to come in around the 17722 area and from there if price can continue the move higher, the recent highs would be the next major resistance on the cards. If price fails and moves lower below the support level, then the 17300 support area could once again become a new price flip and flip from a support level to a new resistance.
US30 Daily Chart


Leave a Reply